
The short answer
The cleaning robot ROI in Nashville comes from the floor hours a robot takes over from janitors and building cleaners, set against a fixed lease payment that is quoted after a free site assessment. Expect a savings range rather than a promise, and expect that range to move with floor layout, schedule and how much of the scheduled work the robot can actually cover. The government wage data panel on this page supplies the local wage for this job, and the site walk turns the range into a figure for your building.
See what a cleaning robot costsRun the numbers in the ROI calculator
Key takeaways
- The return comes from floor hours the robot takes over, valued at the local wage for this job.
- Savings are a range that depends on floor layout, schedule and the share of work the robot can cover.
- Passes on mapped open floor during empty hours produce the most usable hours.
- Downtime, staff pushback and overstated hours are the main risks to the return.
- A free site assessment turns the range into a lease quote and a figure for your building.
Run the numbers for your site
Auto-detected from your location - we use the real BLS wage here. Not right? Pick your city or state above.
What do you want to automate?
The robot runs the open floor overnight; your crew keeps detail and edges.
What return can a Nashville business expect from cleaning robots?
The cleaning robot ROI in Nashville comes from one place for most sites: the hours of floor work the robot takes over from janitors and building cleaners. Those hours are valued at the local wage for this job shown in the government wage data panel on this page, and the lease payment is the other side of the comparison. The result is a savings range that moves with the site, not a fixed promise.
The range is only as good as the hours behind it. A robot that runs a pass every night on mapped, open floor takes real work off the shift. A robot that sits idle because aisles are blocked or the schedule was never set does not. The rest of this guide explains which of those two cases a given building is likely to be.
Where does the return come from in a Nashville building?
Janitors and building cleaners are a large workforce. According to the Bureau of Labor Statistics Occupational Outlook Handbook, about 2,447,700 people held these jobs in 2024, and about 351,300 openings a year are expected, mostly from replacement rather than new positions. The same handbook projects 2% growth from 2024 to 2034, which it describes as slower than average. The work does not disappear with slow growth, so the staffing question stays open for most buildings.
The same occupation carries a heavy injury load. According to the BLS injury and illness snapshot for this group, 21,100 nonfatal cases involving days away from work were counted in private industry in 2020. BLS chart data for the same occupation shows the incidence rate rising from 137.1 cases per 10,000 full-time equivalent workers in 2018 to 157.4 in 2019 and 191.6 in 2020. The BLS figures do not break these cases down by task, so the savings range on this page counts hours only and prices no safety benefit.
Median hourly wage, Janitors and Building Cleaners
$3,929
Monthly cost of one full-time worker in Nashville, TN, at the median wage plus payroll costs (an estimate, not a quote).
How does the savings range work?
The math has three inputs. The first is the hours per week that the robot takes over, counted as a share of total cleaning hours on the site. The second is the local wage for janitors and building cleaners, taken from the government wage data panel on this page. The third is the fixed lease payment, quoted after a free site assessment and not shown as a standalone figure here. The hours offset, valued at that wage, is set against the lease payments and setup effort over the lease term.
The hours offset is not all hours. A robot covers open, mapped floor such as main corridors, open sales floors and loading bays. People still handle restrooms, spills, trash, glass, furniture moves and anything the robot cannot reach. The realistic share is the portion of scheduled floor passes that fit the robot, and the site walk measures that share directly rather than assuming it.
The wage in the panel is a base wage. Benefits, payroll taxes, supervision and turnover costs are real but are not in that figure, so a range built on the wage alone sits at the conservative end. Payback comes when the cumulative hours offset has covered the lease payments and setup effort.
What changes the number up or down?
Floor layout moves the range more than anything else. Long open runs with few obstacles give the robot more usable floor per pass than a building cut into small rooms with furniture in every path. Each blocked route is a set of hours the robot cannot take over.
Schedule is the second factor. Overnight or early-morning passes on empty floor are where the robot does its best work. A site that needs the floor cleaned mid-day, with people walking every aisle, gets less from the same machine.
Floor type and soil load matter too. Smooth sealed concrete and tile are simpler to cover than carpet, thresholds and heavily soiled zones. The assessment records which zones a robot can cover without staff help.
Which floor hours does the robot take over?
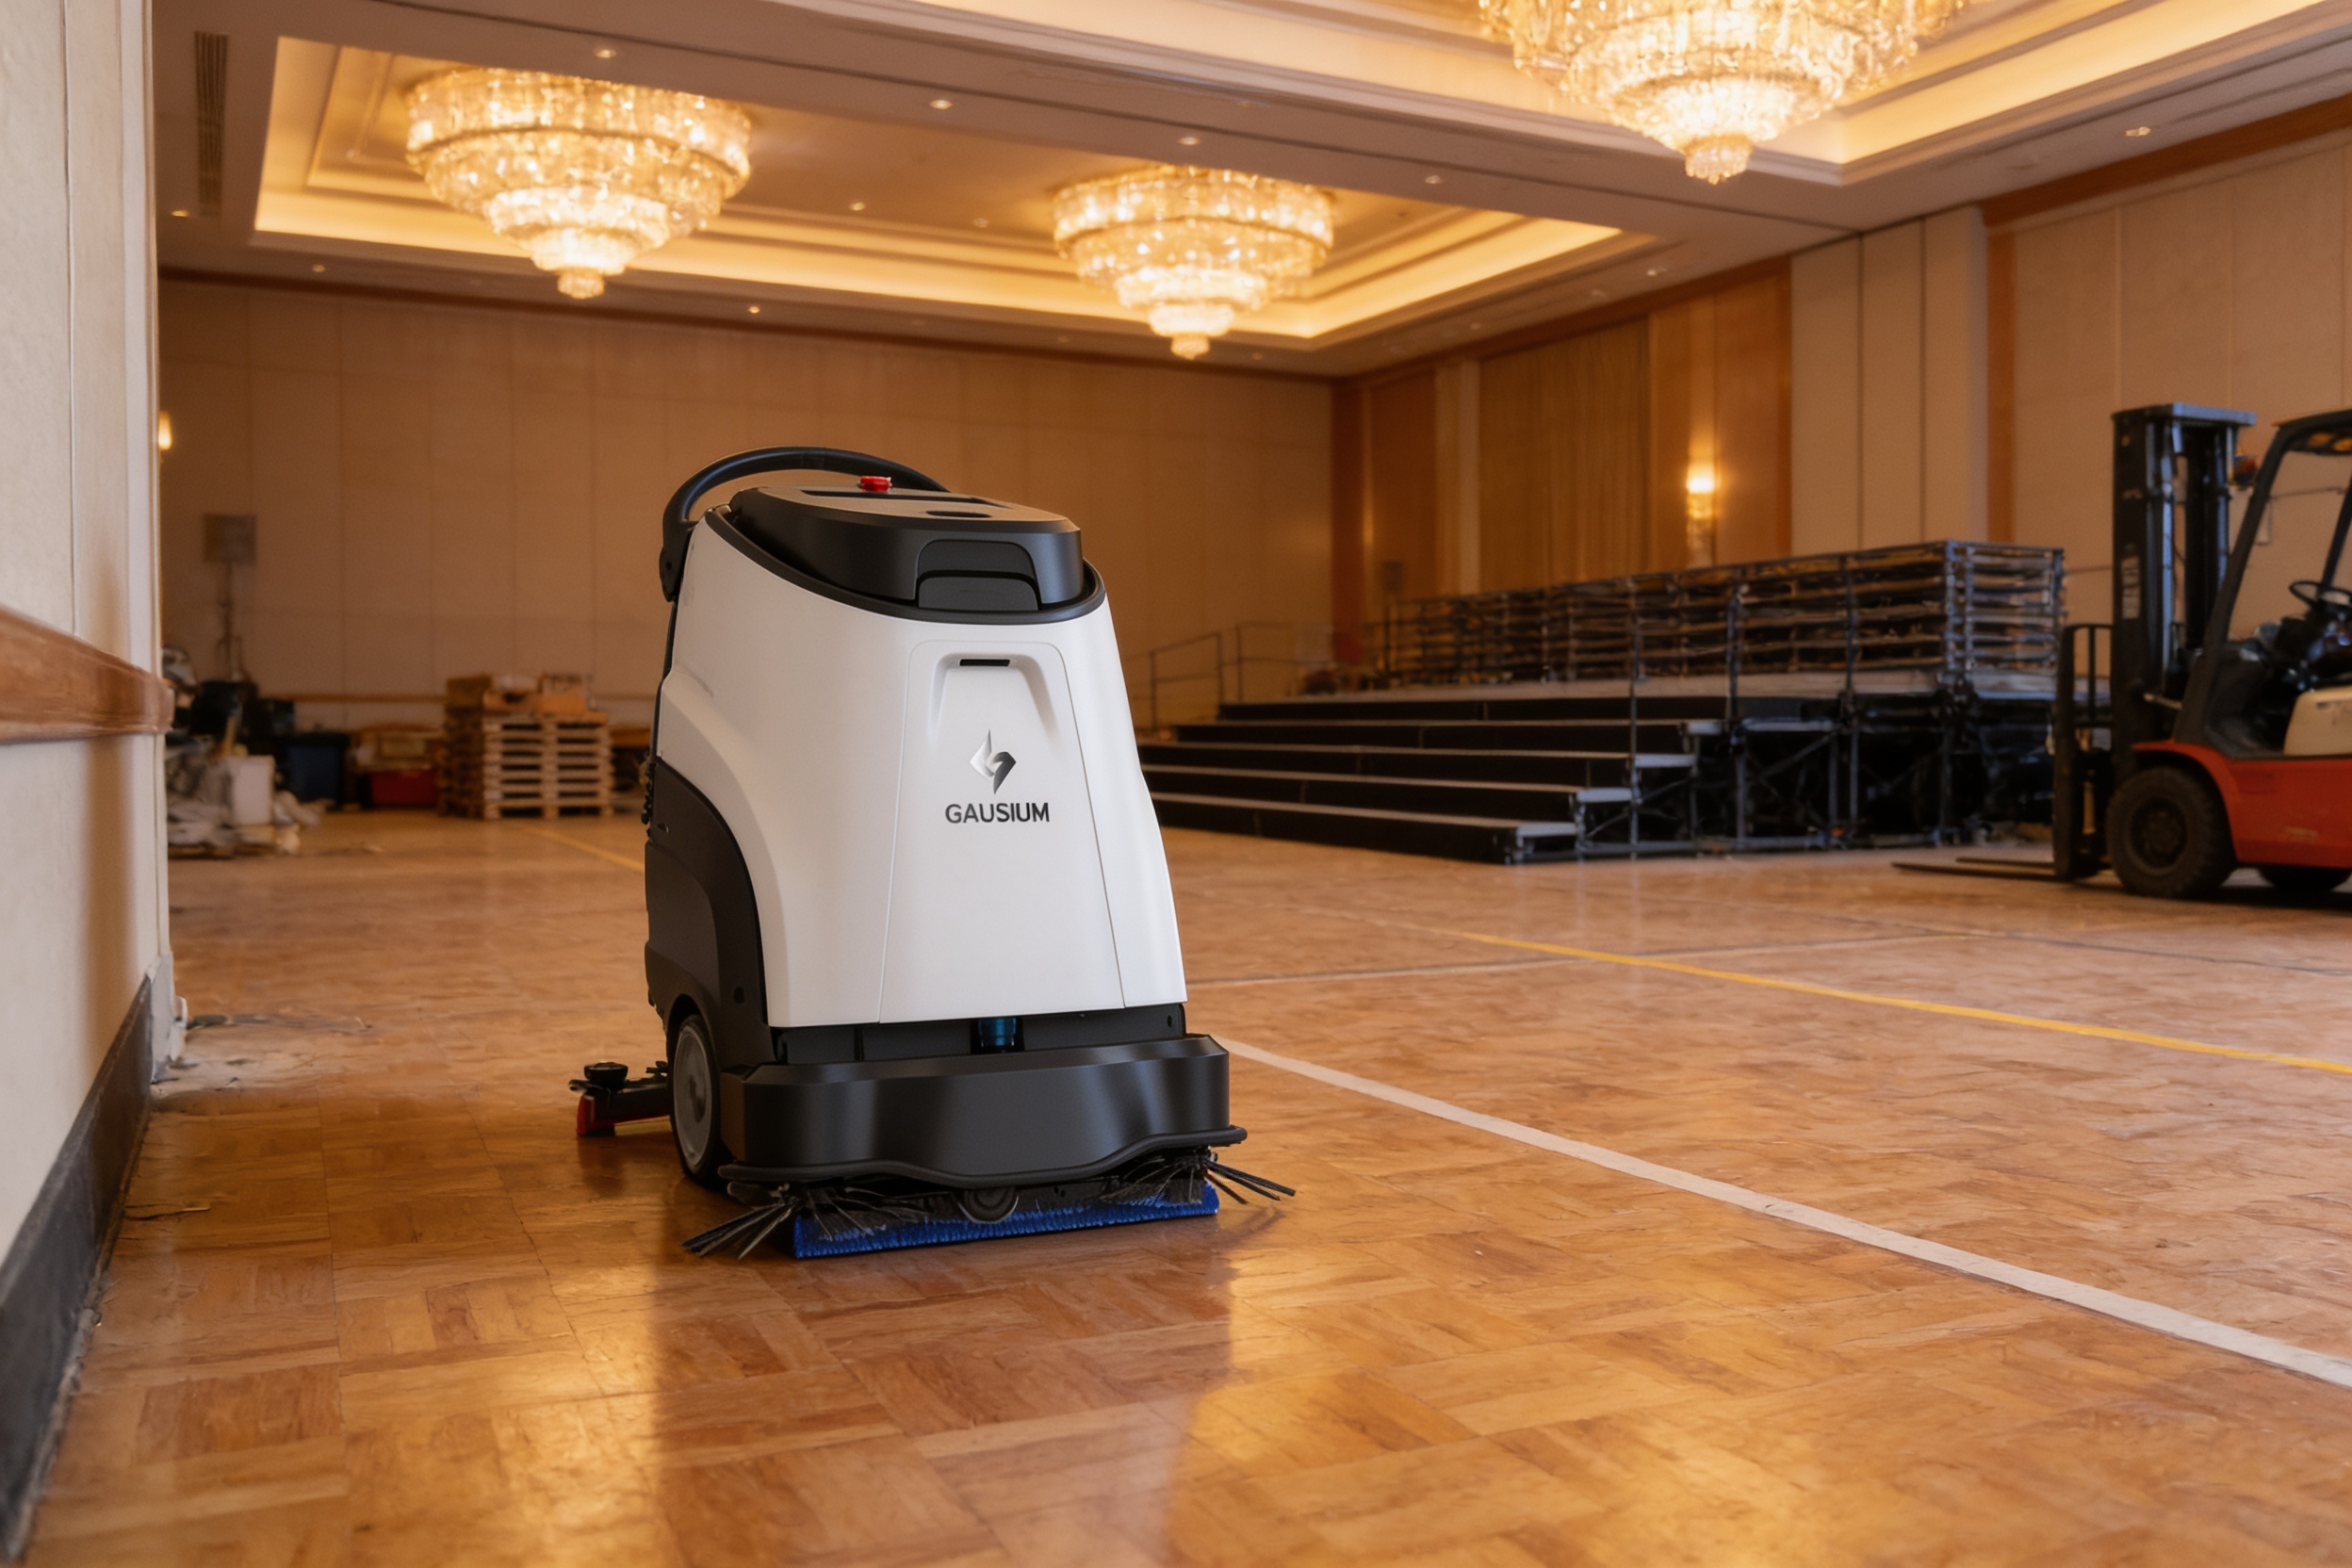
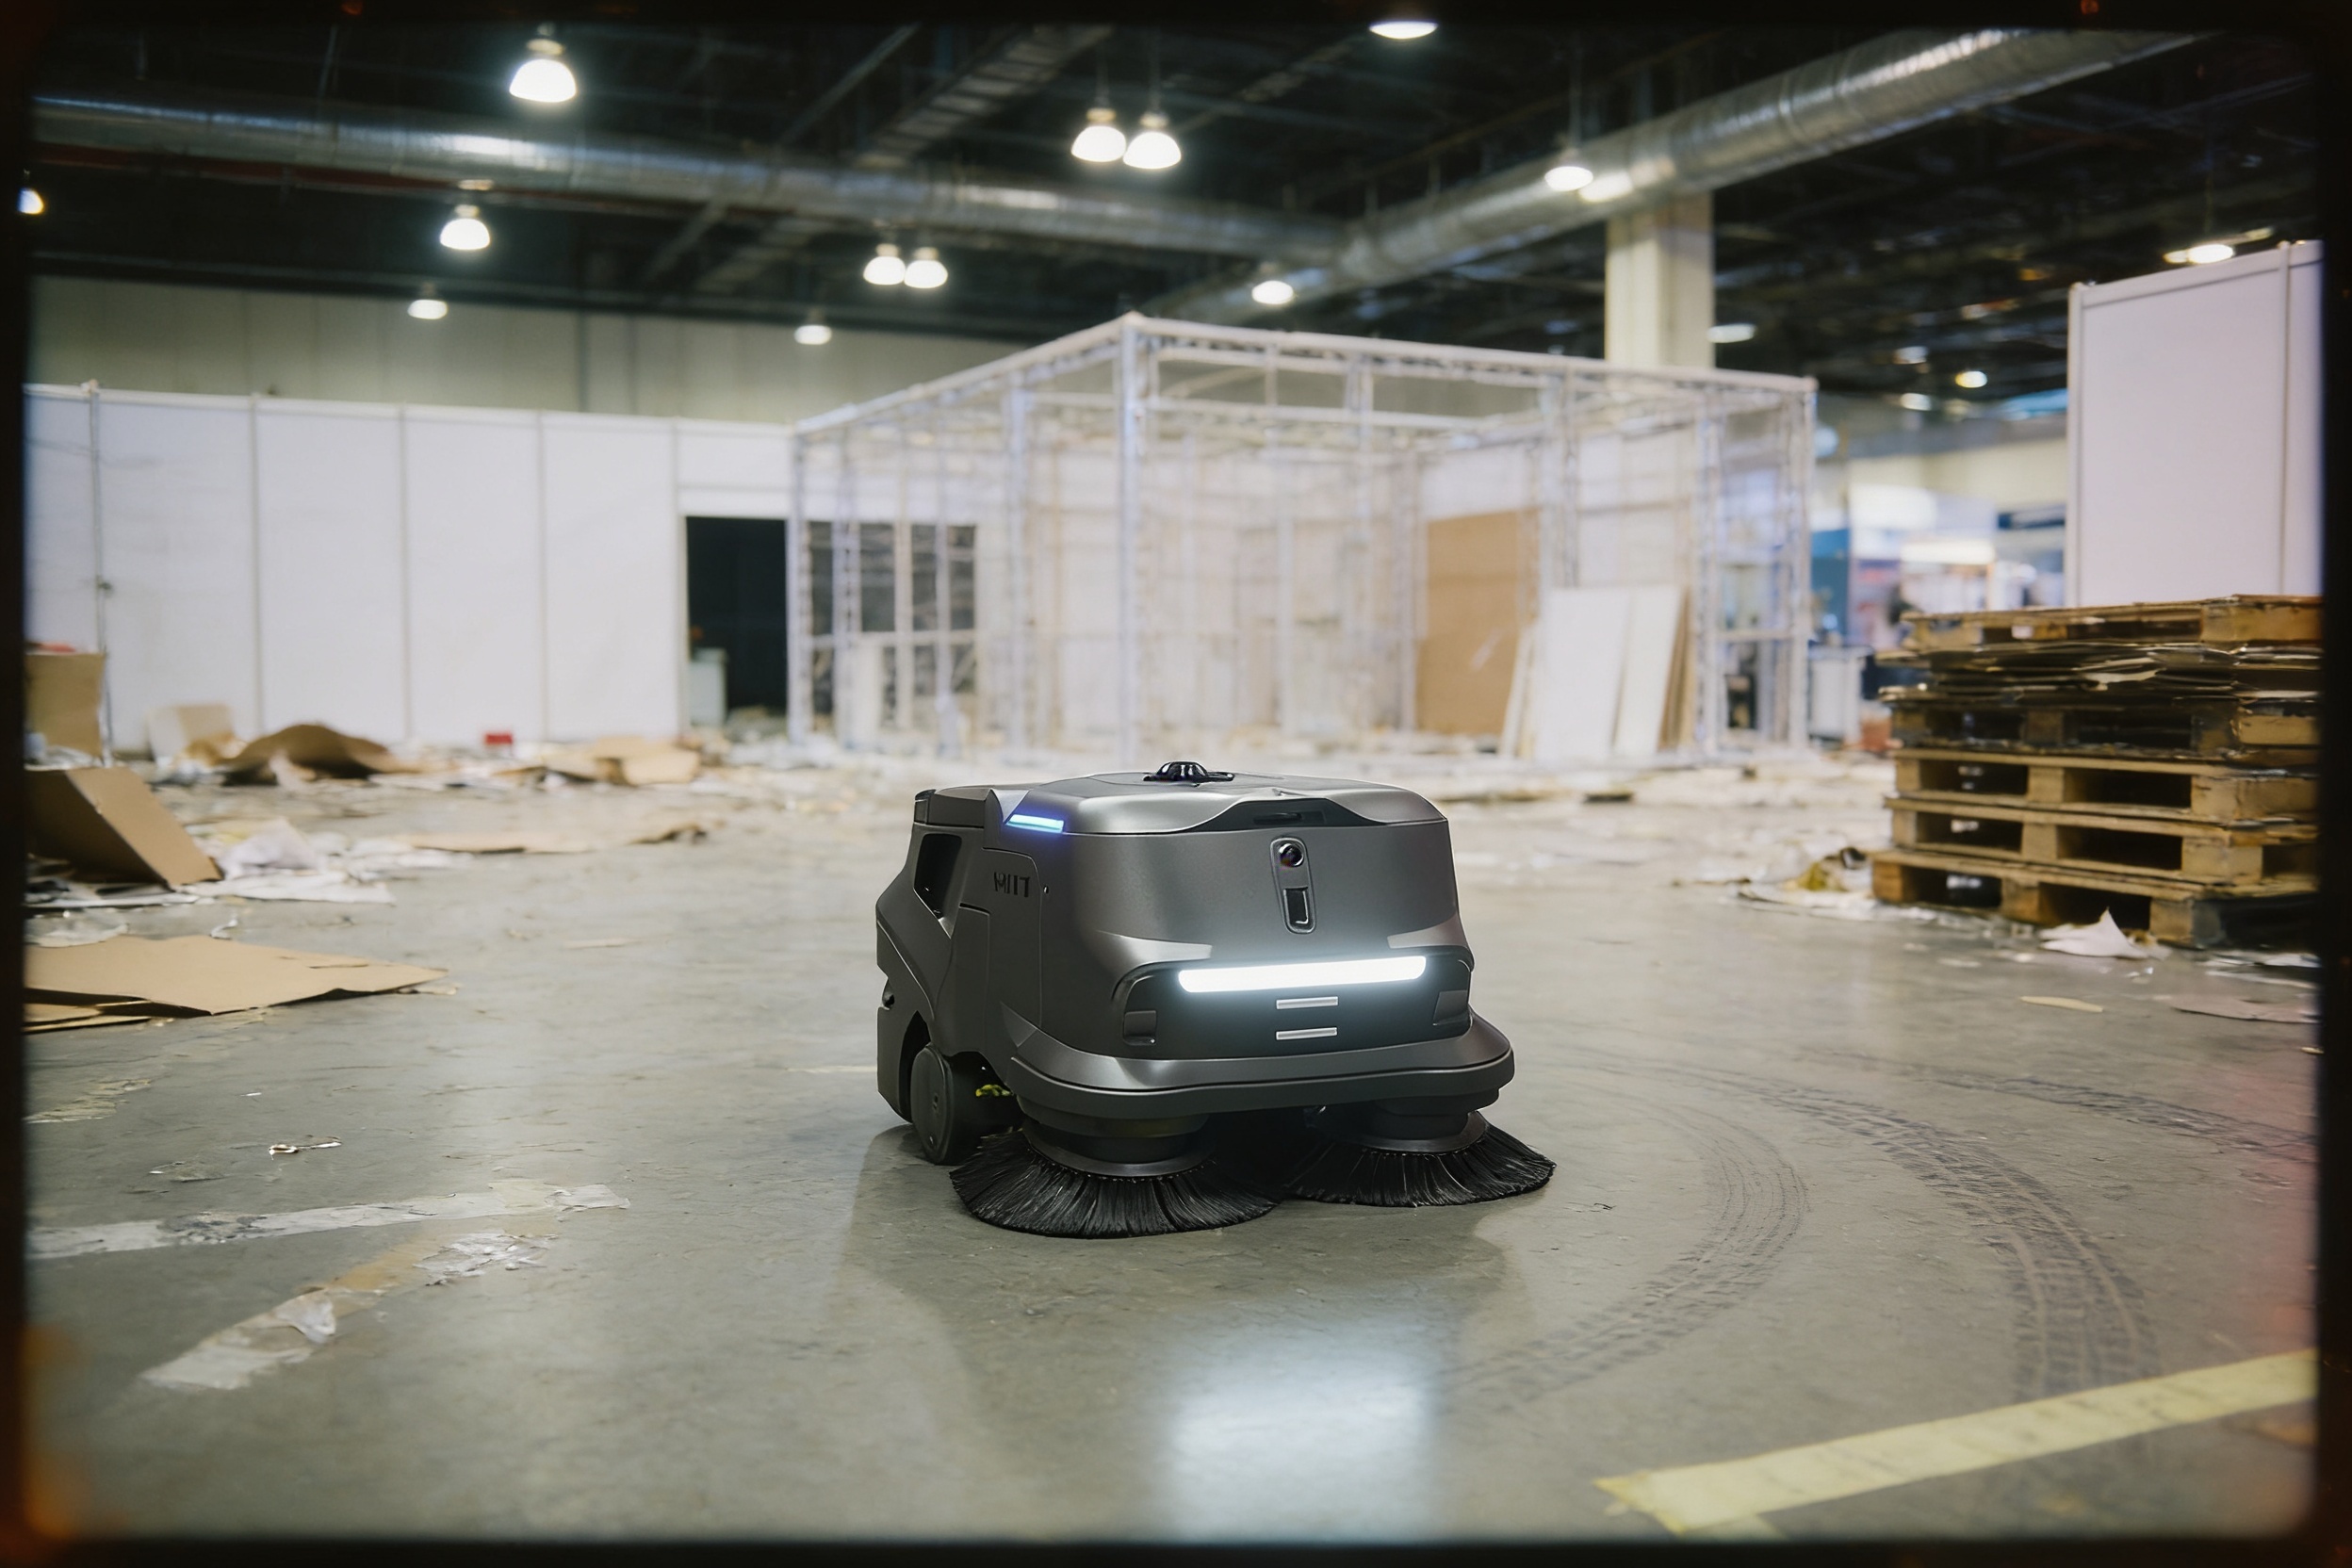
Hours are measured on your floor, not taken from a generic table. The walk-through records how long each floor task takes today, how often it runs, and which areas are open enough for unattended operation. The table below shows the split the assessment produces, with the hour values left for the site walk to fill in.
Work that stays with staff is part of the return, not a gap in it. Restrooms, spills, trash and detail work keep the crew busy, and the robot frees time for those tasks by removing the routine passes.
| Task | Today | With a robot |
|---|---|---|
| Scheduled pass on main corridors | Measured on site, counted per shift | Robot runs the pass; staff set the route once |
| Sweeping or scrubbing open floor areas | Measured on site, counted per night or week | Robot runs unattended on mapped open floor |
| Spills, restrooms, trash and detail work | Stays with staff; scope measured on site | Unchanged; staff still handle it |
| Checking the robot and its route | None | Short daily check, logged by staff |
| Mapping and route setup | None | One-time mapping during deployment |
Hour values come from each site's own walk-through, not from a benchmark table. This page shows the kind of split the assessment produces.
What are the risks to the return and how do you avoid them?
The biggest risk is an underused robot. If the floor map does not match the real layout, or the schedule drifts into busy hours, the robot runs fewer useful passes and the hours offset falls. Write the schedule and routes into the deployment plan, and check the robot logs during the first weeks.
Staff pushback is the second risk. If the people who used to run the floor machine are not told what happens to their work, they may route around the robot. Plan the new split of tasks with the crew before go-live, and treat the freed time as time for work the robot cannot do.
Downtime is the third. A robot out for service during a shift leaves that floor uncleaned. Ask whether repairs and remote triage are included in the lease quote, how fast on-site dispatch happens, and whether a loaner unit covers the gap.
Overstated savings is the fourth. Any range that assumes the robot takes every hour of floor work is wrong. Hold the savings figure to the share the site assessment confirmed.
How long does it take from assessment to payback?
The path follows a fixed order. The site assessment comes first, then the floor is mapped, then the lease quote follows, then installation and integration, then staff training and go-live support. The quote states the install date and the service terms, so the timeline is written down before any commitment.
Payback starts counting once the robot runs its planned schedule, not on the day it arrives. The early weeks go to tuning routes, checking obstacles and building the log history that shows the real hours taken over. Payback arrives when the hours offset, valued at the local wage, has covered the lease payments and setup effort.
How do you get an exact figure from a free site assessment?
A free site assessment turns a range into a figure for your building. The walk records zones and hours, checks floor type and access, and selects a robot that fits the layout. The output is a written proposal with the fixed lease payment quote, the install plan and the service terms.
We lease, deploy, integrate, train staff and service robots nationwide. The team that walks the floor also sets the routes and runs go-live support, so the figure in the proposal has a clear owner. Ask for the hours the robot takes over, the wage used and the coverage assumptions in writing, so you can check each one.

Does a cleaning robot reduce cleaning staff?

Often the crew's work changes more than its headcount. The Bureau of Labor Statistics projects slow growth for this occupation, and its openings are mostly replacement openings, so changes usually come through turnover and scheduling rather than a single cut.
The FM Benchmarking data cited by FMLink gives a median of about 20,000 gross square feet cleaned per worker, with the best quartile near 25,000. For a site of about 80,000 gross square feet, the median implies about 4 cleaning workers, which is the crew size used for this page. The robot changes the hours on that crew, and the crew size changes only if the site decides to reduce it.
The most recent AACEM and ISSA Autonomous Cleaning Survey located for this page dates from 2019. It surveyed nearly 23,000 contractors, in-house providers and facility managers, and autonomous cleaning equipment users were 27% of respondents. About one-third of non-adopters said they were somewhat likely to adopt within a year. Treat that as a dated direction, not a current count of facilities.
Frequently asked questions
Put a robot to work in Nashville.
We walk your site, learn the job, and recommend the unit that fits. Then we quote the lease, deploy it, and keep it serviced.
Sources
- US Bureau of Labor Statistics, Occupational Employment and Wage Statistics (OEWS May 2024)
- BLS Occupational Outlook Handbook: Janitors and Building Cleaners
- BLS injury and illness snapshot: Janitors and Cleaners, 2016 to 2020
- BLS chart data: Janitors and Cleaners, 2020
- FM Benchmarking janitorial staffing data, via FMLink
- AACEM and ISSA Autonomous Cleaning Survey, via FMLink