
The short answer
Autonomous forklift ROI in Nashville comes from labor hours the robot takes over on repeat pallet and freight moves, valued at the local wage for laborers and freight, stock, and material movers, hand. Savings are a range that moves with shift count, travel distance and steady volume, not a fixed promise. The lease payment is fixed and quoted after a free site assessment, and payback is the point where net savings after that payment cover any one-time costs in the quote.
See what a autonomous forklift costsRun the numbers in the ROI calculator
Key takeaways
- The return comes from repeat moves taken off laborers and freight, stock, and material movers, hand.
- BLS counted 37,980 people in this occupation in the Nashville metro area in May 2024.
- Savings are a range that depends on shift count, travel distance and steady volume.
- The lease payment is fixed and quoted after a free site assessment.
- Safety gains are real, but the published figures do not price them for Nashville.
Run the numbers for your site
Auto-detected from your location - we use the real BLS wage here. Not right? Pick your city or state above.
What do you want to automate?
The robot takes the repetitive cart and pallet moves off the heaviest motion.
What is the return on an autonomous forklift in Nashville?
Autonomous forklift ROI in Nashville starts with the hours of repeat work the robot can take off the floor. An autonomous forklift earns its place by running the same moves over and over without a driver. In a receiving or shipping area, that usually means pallets moved between dock doors, staging lanes and racking, which takes up much of a shift. The return is the value of those hours, not the robot's cost on its own.
Whether the return is worth chasing depends on three things you can measure in your own operation: how many hours of repeat moves happen each week, how far those moves travel, and how steady freight volume stays through the year. Nashville adds a local layer, because the wage that values those hours comes from government data for laborers and freight, stock, and material movers, hand.
Why does Nashville's material-moving labor base matter?
According to the Bureau of Labor Statistics, 37,980 people worked as laborers and freight, stock, and material movers, hand in the Nashville metro area in May 2024. The location quotient for that group was 1.79, meaning local employment in the occupation ran 1.79 times the national rate. That concentration suggests the work is a normal part of the local job base, so the hours a robot would take are familiar work rather than an unusual task.
A later BLS release for the same metro area reported 118,420 jobs in transportation and material moving occupations in May 2025, which it put at 10.8 percent of local employment against 8.8 percent nationally. That group includes truck drivers, so it is broader than the work this page prices. It still shows how much of the local job base is built around moving goods.
According to the Federal Reserve Bank of St. Louis (FRED), employment in transportation, warehousing and utilities in the Nashville metro rose from 71.9 thousand in 2023 to 72.9 thousand in 2024, and reached 77.1 thousand in December 2025. A local news analysis of BLS data read the above-average share of material-moving jobs as a sign of strong local demand to receive and move goods.
Median hourly wage, Laborers and Freight, Stock, and Material Movers, Hand
$4,427
Monthly cost of one full-time worker in Nashville, TN, at the median wage plus payroll costs (an estimate, not a quote).
Where does the return come from in this setting?
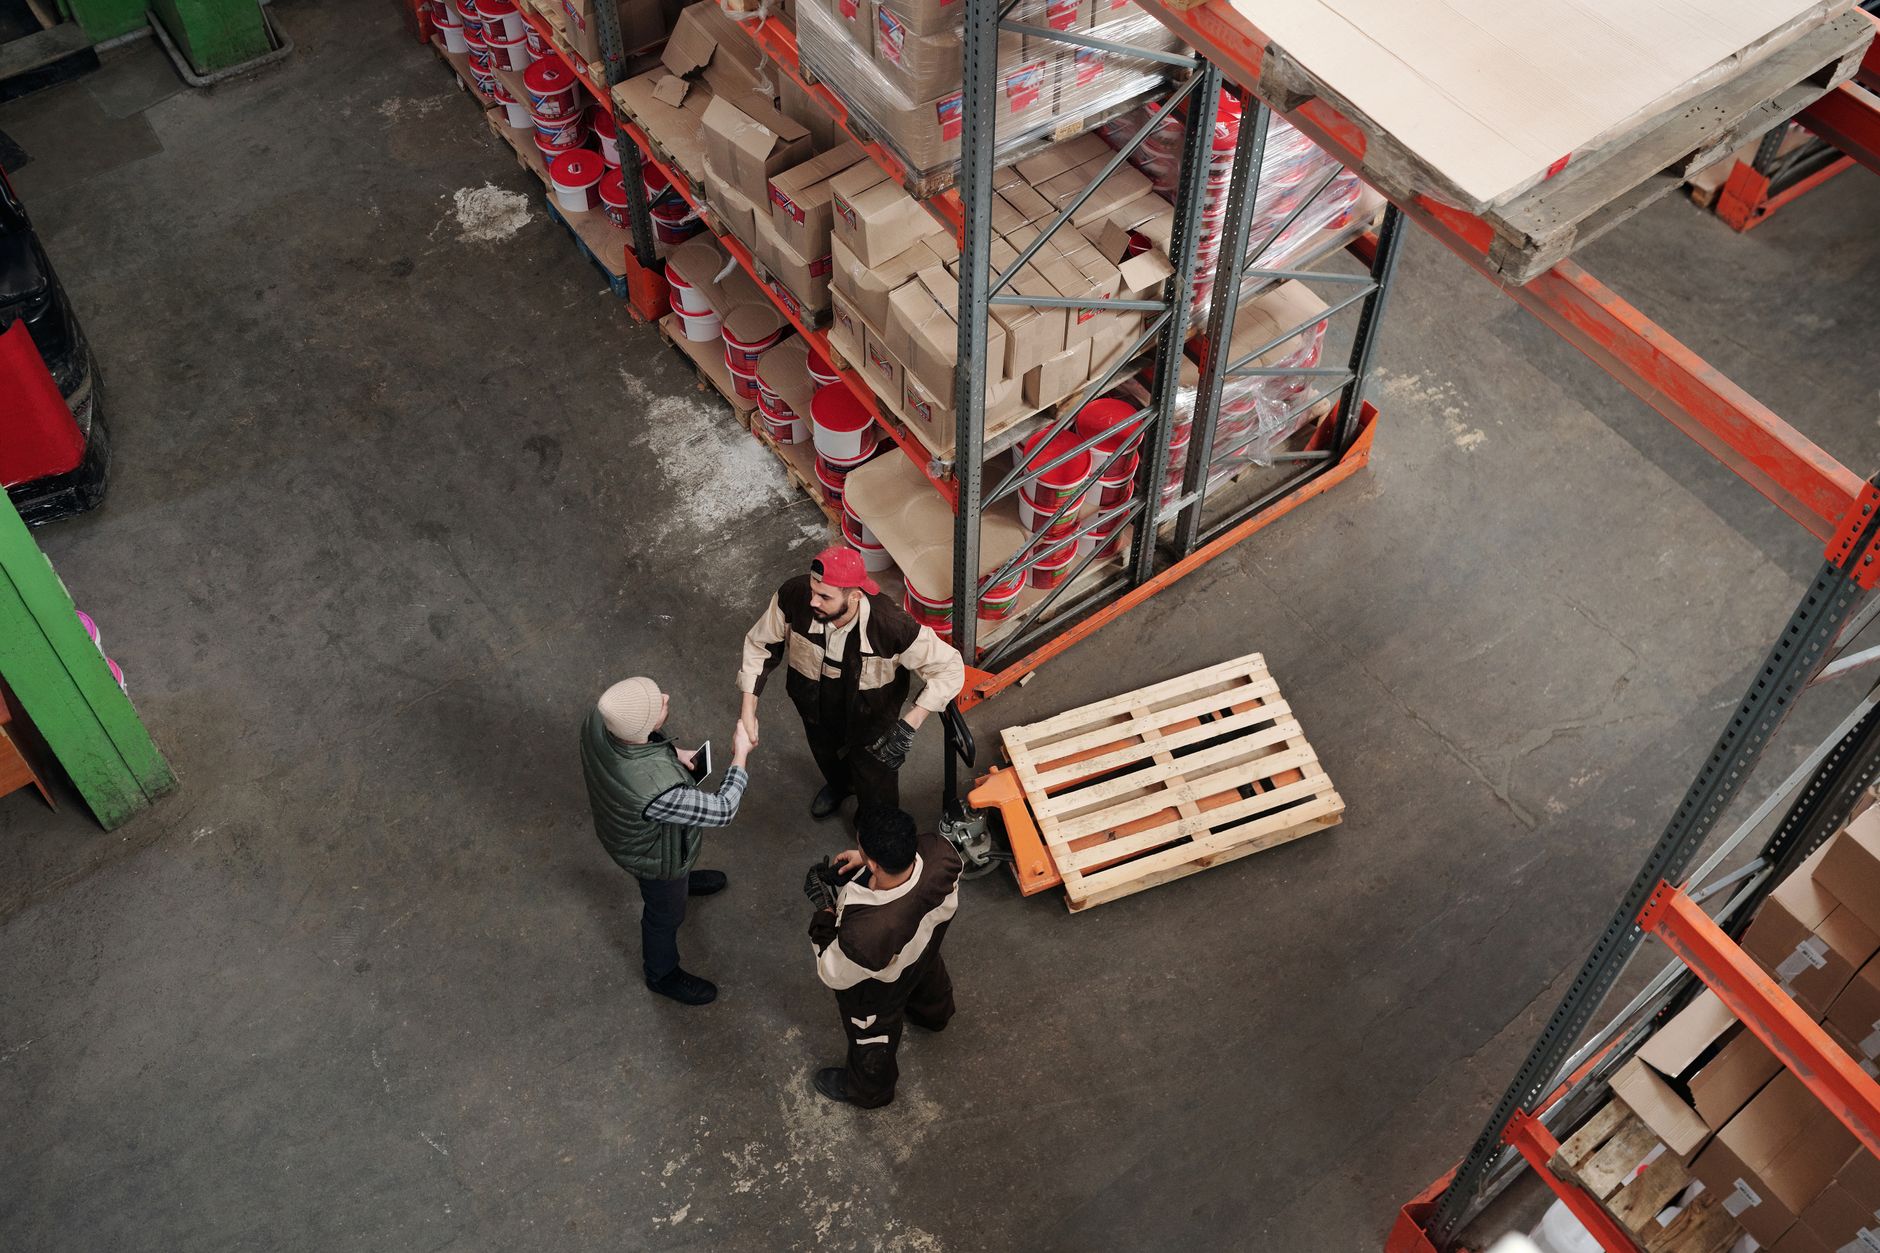
The return comes from hours taken off the repeat part of the work, and the robot does not need to take all of it to pay off. In most receiving and staging areas, work splits into long repeat routes between fixed points, short tasks that need a person's judgment, and a mix of the two. A robot fits the first group well, and the second stays with staff.
Most of the savings sit in the transfer work near docks and racking, where moves are frequent and predictable. A robot on that route replaces a person who would otherwise walk or drive the same path many times in a shift. The hours that free up are hours of laborers and freight, stock, and material movers, hand, which is the occupation the savings model values.
Freed hours do not become savings on their own. They turn into lower labor cost when a shift is trimmed, overtime is avoided, or temporary help is no longer needed. If the freed time only fills gaps, the return shows up as spare capacity instead, which is real value but counts differently in the payback check.
How does the savings math work?
The model runs on three inputs. The first is the annual hours of repeat moves that fit a fixed route. The second is the share of those hours the robot can realistically take, since some moves need a person and the robot will not reach every lane. The third is the lease cost, a fixed payment quoted after a site assessment.
The gross offset is the robot's share of hours multiplied by the cost of an hour of laborers and freight, stock, and material movers, hand, valued at the local wage shown on this page. From that, subtract the lease payment, the staff time spent on supervision and checks, and any recurring service costs in the quote. What remains is the net contribution each month, and the savings range comes from running that calculation with low, middle and high assumptions for hours and robot share.
Keep the range honest. The low case assumes fewer usable hours and a smaller share of work taken. The high case assumes steady volume and a route that uses the robot fully. Neither case is a promise. The actual figure comes from your logs, your layout and your shift pattern, not from a national average.
What pushes the number up or down?
Four things push the return up. More shifts each day spread the fixed lease cost over more useful work. Longer repeat routes give the robot more hours to take. Steady volume through the year keeps those hours from disappearing in slow months. A layout the robot can navigate without workarounds raises the share of hours it can take at all.
Four things pull it down. Short and scattered moves leave little to automate. Seasonal swings can leave the robot idle for months. A high exception rate means staff still handle much of the same work. Aisles that are narrow, cluttered or shared with heavy mixed traffic force slow routes and limit the share of hours taken. The checklist below covers what to test before deciding.
Are autonomous forklifts safe, and do injury figures change the case?
The Bureau of Labor Statistics reported 1,391 fatal work injuries in transportation and material moving occupations in 2024, down 7.0 percent from 1,495 in 2023. The fatality rate for that group was 12.5 per 100,000 full-time equivalent workers in 2024, down from 13.6, while the overall national rate was 3.3 per 100,000 in 2024.
Forklift risk is measured separately. An older OSHA regional enforcement directive on powered industrial trucks estimated about 85 forklift fatalities and 34,900 serious injuries a year. A Johns Hopkins research summary put the number of workers fatally injured in forklift and powered industrial vehicle incidents at about 100 a year. These sources use different methods, so they show scale rather than one agreed count.
Fewer people walking and driving through the same aisles can reduce exposure, and that is a real benefit. The published figures do not give a Nashville rate for these incidents, so this page does not put a value on safety. Count it in your own review, and use your existing incident log as the baseline.
What are the risks to the return, and how do you avoid them?
The biggest risk is low utilization. A robot that sits idle because a route changed or volume dropped keeps its lease cost while the hours it was meant to replace return to the payroll. Avoid this by starting on the most repetitive lane, and by writing the route list before the robot arrives.
Layout drift is the second risk. New racking, moved dock doors and temporary pallet stacks can break a route. Set a re-mapping schedule and assign one person to log changes. Downtime is the third. A unit out for service stops hours, so spare unit coverage and a backup robot program keep the route running while a repair is made.
Staff resistance is the fourth. If the team sees the robot as a threat, they will route around it. Name who owns exceptions, say what happens to the hours freed, and train people on the stop and resume steps. One service contact across the fleet makes those steps easier to manage through the first months.
How long does payback take, from assessment to go-live?
A realistic path runs in stages. Site assessment and mapping come first, then route design and a pilot on one lane or one unit. Go-live support and staff training follow, and the logged hours are reviewed after the first full cycle of shifts. The length of each stage depends on site size and layout, so the assessment sets the dates.
Payback is measured from go-live, not from the signature. In the first weeks, the hours usually run below the model while staff learn exceptions and the route is tuned. Once the route holds steady volume, the logged hours become the number you check against the quote. Keep the same logs you used for the model so the comparison is clean.
If a unit needs service during the pilot, log that visit as lost hours. The review should reflect real conditions, including the days the robot was out, so the payback date is one you can rely on.
How do you get a precise figure from a free site assessment?
An autonomous forklift ROI in Nashville range becomes your number after a free site assessment. We map the floor, log the moves you name, measure route lengths and check the layout for the robot's path. From that, we choose the right robot for the site, which may mean a single unit to start, and build the savings model from your hours rather than from averages.
The lease payment comes after the assessment. We lease robots through financing, so the payment is a fixed amount quoted for your site. We deploy and integrate the robot, train your staff and service it nationwide, and the quote lists those terms in writing so you can check them line by line.
Bring three things: recent dispatch or move logs, an up to date floor plan, and your shift schedule. With those, the range narrows quickly and the payback timeline reflects your operation. A single pilot unit is a practical way to test the hours before committing to more.
Frequently asked questions
Put a robot to work in Nashville.
We walk your site, learn the job, and recommend the unit that fits. Then we quote the lease, deploy it, and keep it serviced.
Sources
- US Bureau of Labor Statistics, Occupational Employment and Wage Statistics (OEWS May 2024)
- BLS Nashville OEWS release, April 2025
- BLS Nashville OEWS release, July 2026
- FRED, Nashville transportation, warehousing and utilities employment
- BLS Census of Fatal Occupational Injuries, 2026 release
- OSHA regional enforcement directive on powered industrial trucks
- Johns Hopkins research summary on forklift injuries
- Local news analysis of BLS data, Nashville