
The short answer
Cleaning robot ROI in Omaha comes from the hours of janitor and building cleaner work a leased robot takes off the night crew, valued at the local wage for this job and measured against the lease cost. The result is a savings range, not a fixed figure, and it moves with floor area, shift pattern and how much of each shift the machine can run unattended. A free site assessment turns that range into a number for your building.
See what a cleaning robot costsRun the numbers in the ROI calculator
Key takeaways
- The return comes from machine hours that replace janitor and building cleaner hours, not from a headcount cut.
- The share of work a robot runs unattended matters more than total floor size.
- Floor coverage per hour is an estimate from vendor literature, so measure it on your own floor.
- Unfilled night shifts and overtime can add more value than the wage line alone.
- The lease quote and the final savings range both come after a free site assessment.
Run the numbers for your site
Auto-detected from your location - we use the real BLS wage here. Not right? Pick your city or state above.
What do you want to automate?
The robot runs the open floor overnight; your crew keeps detail and edges.
How much return can a cleaning robot deliver in Omaha?
Cleaning robot ROI in Omaha depends mostly on how many hours of janitor and building cleaner work a leased machine can take off the night crew, priced at the local wage for this job. The government wage data on this page gives that local rate, so the labor side of the math is set by Omaha and not by a national average. Everything else in the result comes from your building: its floor area, its shift pattern and the share of the floor a machine can run without a person beside it.
Omaha has a sizable base of people doing this work. According to Stacker, citing Bureau of Labor Statistics data for May 2024, janitors and cleaners, excluding maids and housekeeping cleaners, totaled 6,350 in the Omaha area, about 12.94 per 1,000 jobs. Stacker is a secondary summary, so treat that count as context. It shows the work is common in the metro, which also means cover problems on night shifts are common.
Read the output as a range. Two buildings of the same size can land far apart, because one runs a single evening crew and the other runs a split shift with a short deep-clean window. A range that stays positive under a conservative share of work is a firmer basis for a decision than one headline number.
Where does the return come from in an Omaha cleaning operation?
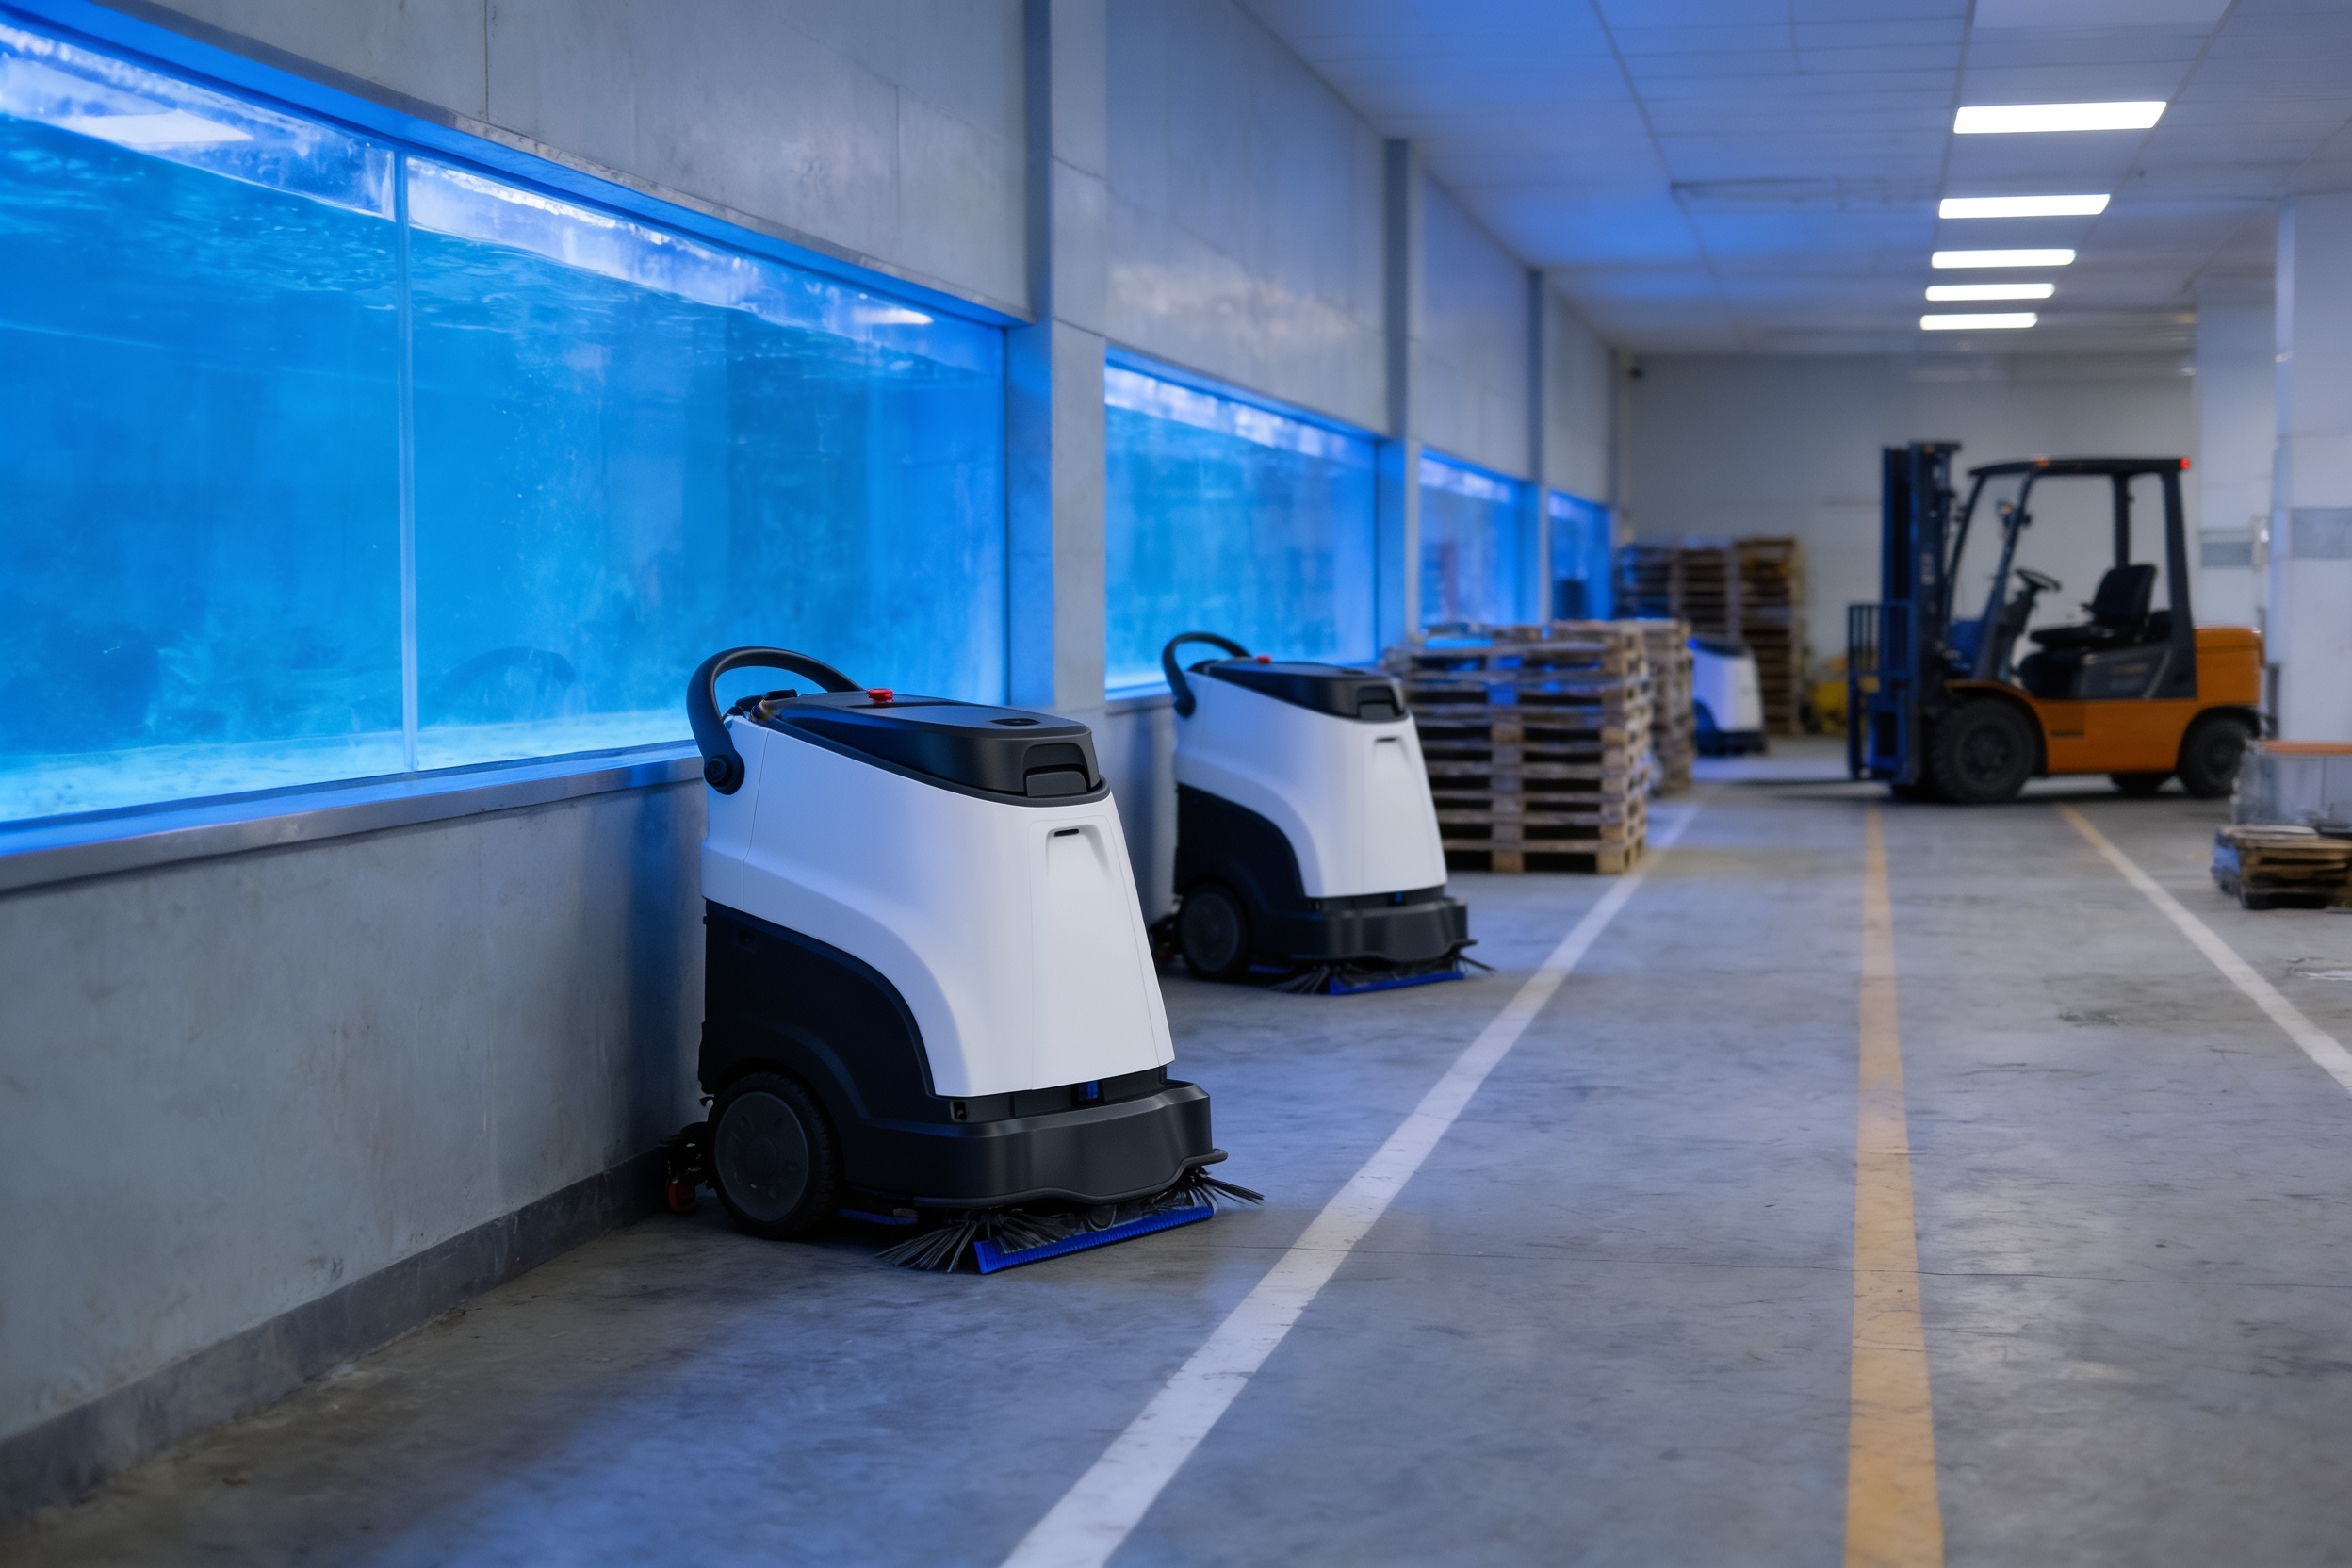
Most of the return comes from floor scrubbing and sweeping on open, repeatable routes: corridors, lobby floors, open office space, warehouse aisles, break rooms and parking ramps. These are long runs with few obstacles, and they are the work a scrubber does best. Restrooms, stairs, tight corners and spill response stay with people, which is why the robot's share of crew hours is smaller than the building's total floor hours.
Machine output is the number most buyers ask about, and vendor literature is where it is published in detail. One vendor guide cites 8,000 to 12,000 square feet per hour for compact walk-behind scrubbers and 35,000 to 70,000 square feet per hour or more for ride-on machines, and notes that obstacles, turns, operator pace and floor condition all lower real output. A second vendor post cites 9,740 square feet per hour for a 20-inch walk-behind, citing a manufacturer productivity table. These are estimates, not guarantees.
At the compact walk-behind rates, 10,000 square feet takes roughly 50 to 75 minutes of machine time before turns, refills and detours are counted. That arithmetic is the starting point for the hours on this page. The site assessment replaces it with a measured figure from your floor layout.
Median hourly wage, Janitors and Building Cleaners
$3,980
Monthly cost of one full-time worker in Omaha, NE, at the median wage plus payroll costs (an estimate, not a quote).
How does the savings math work, step by step?
Start with the hours of janitor and building cleaner work the robot takes over each week. Multiply those hours by the local wage for this job from the panel, adding the employer cost of wages and benefits if your payroll carries it. That gives the labor value of the robot's share. Subtract the lease cost from the quote, along with any cost you still carry for staff time, consumables or charging. What remains is the savings range.
The share is the input people get wrong most often. A robot does not take every minute on the floor. It runs the open routes it can finish unattended and leaves the rest to people, so the input is the share of work it realistically runs without help, not the total floor hours in the building. Use a conservative share first, then test a higher one, and check whether the result still holds at the low end.
Count the hours that do not show on the wage line as well. Overtime, unfilled night shifts and the cost of covering a sick call are real, and for many sites they are where a leased robot pays back fastest. Include them only when your records show them, so the range stays honest.
How many hours does a cleaning robot actually take over?
The hours depend on the task, and the table below shows how the work breaks down. The times are not fixed. They scale with floor area and with how many open routes the building has. This page plans on two people on the night crew at a site of this kind, and the assessment confirms the real count and the real route.
Staffing is where hours quietly disappear. According to the Bureau of Labor Statistics Occupational Outlook Handbook, there were 2,447,700 jobs for janitors and building cleaners in 2024, with about 351,300 openings a year projected, mostly to replace workers who leave. Projected growth for 2024 to 2034 is 2 percent, which BLS calls slower than average. When openings come mainly from workers leaving, a night shift can sit unfilled for a while, and each unfilled shift is floor time nobody covers.
Use your own payroll and turnover data in the assessment rather than an industry average. Published turnover estimates for cleaning work vary widely, and the ones we reviewed were vendor or aggregator figures that we could not confirm against the original surveys.
Is janitorial work risky, and does a robot change that?
Janitorial work carries a real injury burden. According to the Bureau of Labor Statistics injury snapshot covering 2016 through 2020, janitors and cleaners, except maids and housekeeping cleaners, had days-away-from-work rates of 191.6 per 10,000 full-time equivalent workers in 2020, up from 157.4 in 2019. The all-occupations rate for 2019 in the same snapshot was 86.9. The snapshot also reports 42 fatal work injuries for this group in 2020 and 45 in 2019.
A robot does not remove hazards from a floor, and it does not replace care on spills, wet surfaces and stairs. It does take the repeated scrubbing of open lanes away from people, which is a large share of the walking and pushing that loads workers over a shift. Use your own loss runs and incident logs in the assessment, not only the national series.
One gap to know: the injury series in our research has no 2024 or 2025 update, so 191.6 is the most recent published figure we could confirm. Treat it as the latest published year, not as a current rate.
What changes the number up or down?
Several inputs move the savings range more than the others. The floor and the shift pattern set how much work is available to the machine, and the staffing picture sets how much of that work is labor you currently pay for. The checklist below lists what to check before you decide.
Floor condition is a quiet driver. Cracked concrete, raised thresholds, rough transitions and heavy debris cut machine output and push more work back to staff. Smooth, open floors with few obstacles push the other way.
Shift pattern matters too. A single evening crew with a long, repeatable route gives a machine a clear job. A building with a short overnight window and a lot of stop-and-start work returns less, because the machine idles between tasks.
What are the risks to the return, and how do you avoid them?
The most common risk is low utilization. A machine that sits idle because the route is poorly set, the floor is blocked or the charge plan does not fit the shift returns far less than the range suggests. Map the route in the assessment, set a charge window that fits the shift, and review the run log every week during the first months.
The second risk is a mismatch between the lease term and building plans. If the building may change layout, or the operation may change size, write those possibilities into the assessment. Test the range on a smaller route or a single unit first, so the decision rests on measured runs rather than a plan on paper.
The third risk is downtime and staff resistance. A machine that stops with no plan for service or cover puts the crew back on the floor. Ask for the service response plan, backup coverage and training before signing, and give staff a clear role in the route and the exception log so they see the machine as work they manage, not work taken from them.
How long does it take from assessment to payback?
The sequence has a few stages, and the first is the free site assessment. It maps the floor, measures the open routes and obstacles, and records the current shift and crew pattern. That map is what the lease quote is built on, so this stage sets the accuracy of everything after it.
After the assessment come the quote, deployment and integration, staff training and go-live support. The machine runs measured shifts first, and the team checks the share of work it takes against the assessment. Payback is then calculated on measured hours and the actual lease cost, not on the original estimate.
How quickly the return arrives depends on the quote and on the share of work measured in those first shifts. Ask for a timeline built from your floor and your schedule. A building with a clear overnight window and a simple route reaches a measured picture faster than a split-shift site with many obstacles.
How do you get a precise figure for your Omaha building?
Adoption is rising across professional cleaning. According to the International Federation of Robotics, as summarized in trade press, professional service robot shipments rose 24 percent to almost 250,000 units in 2025 globally, and no cleaning breakout was found in that release. A growing market brings more vendor claims, so measured data from your own floor matters more than headline output.
We are a commercial robot integrator. We pick the machine that fits your floor, lease it through financing, deploy and integrate it, train your staff and service it nationwide. The lease quote comes after a free site assessment, where we map the floor, measure real coverage and check the share of work the machine can run. That is the input that turns this range into a number for your building.
Before you commit, compare the robot against the work it replaces, point by point. The table below is honest about where people still do better.
- Route coverage
Cleaning Robot
Repeats open routes the same way on every shift when the floor is clear
Staff
Adjusts on the spot to obstacles, spills and blocked areas
- Night coverage
Cleaning Robot
Runs unattended once the route and charge plan are set
Staff
Needs a scheduled shift, breaks and cover when someone calls out
- Edges, stairs and restrooms
Cleaning Robot
Not a fit for stairs, tight corners or high-touch restroom work
Staff
Handles the full range of detailed cleaning
- Problem solving
Cleaning Robot
Stops and reports when something blocks the route
Staff
Clears a spill, moves a cart or reroutes the work
- Cost per hour on open floor
Cleaning Robot
Lease cost spread across the hours the machine actually runs
Staff
Wage and benefit cost for each hour worked, plus cover for absences
Frequently asked questions
Put a robot to work in Omaha.
We walk your site, learn the job, and recommend the unit that fits. Then we quote the lease, deploy it, and keep it serviced.
Sources
- US Bureau of Labor Statistics, Occupational Employment and Wage Statistics (OEWS May 2024)
- Bureau of Labor Statistics, Occupational Outlook Handbook: Janitors and Building Cleaners
- Bureau of Labor Statistics, injury and illness snapshot for janitors and cleaners, 2016 to 2020
- Stacker, Omaha lowest-paying jobs (secondary summary of BLS data)
- Floor scrubber output guide (vendor blog)
- Industrial cleaning equipment productivity post (vendor blog)
- The Cleanzine, summary of International Federation of Robotics service robot data