

The short answer
Cobot ROI in Nashville comes from labor hours that a cobot takes over from repetitive laborers and freight, stock, and material movers, hand type work, minus the lease cost and the cost of keeping the cell running. The savings range is set by how many of those hours are repetitive and reachable on your floor, how the lease is priced over its term, and how steady staffing is. A free site assessment measures those hours on your floor and turns them into a range and a lease quote.
Key takeaways
- The return comes from repetitive hours of laborers and freight, stock, and material movers, hand type work, not from a fixed savings figure.
- Only the share of cycles a cobot can reach and repeat counts toward the offset, so the assessment measures that share first.
- Turnover in the local transportation and warehousing sector makes these hours harder to fill, which raises the value of offsetting them.
- The lease cost is set in a quote after a free site assessment, and it is the other side of every savings range.
- Payback is reached only after measured hours confirm the range, so plan a review once the first months of data are in.
Run the numbers for your site
Auto-detected from your location - we use the real BLS wage here. Not right? Pick your city or state above.
What do you want to automate?
The cobot stacks the repetitive end-of-line pallets; your team handles changeover and QA.
What is cobot ROI in Nashville?
Cobot ROI in Nashville is the return a business gets when a collaborative robot arm takes over repetitive, hands-on work and the labor hours it frees are worth more than the lease and service cost. The arm works beside people at one fixed station, such as a palletizing cell, a machine tending station, or an end of line packing point. It does not roam the building the way a mobile robot does, so the return is tied to one workstation at a time.
The labor side of the math prices the work the arm takes over at the government wage for laborers and freight, stock, and material movers, hand. That occupation is the closest match for most cobot cells in logistics, packing, and material handling, so the government wage data on this page is the reference. Where the people on the station hold a different job, the arm takes this type of work off their plate, and their time is not priced.
The market context is growing. According to the International Federation of Robotics, new cobot installations reached 66,000 units in 2025, or 11 percent of all industrial robot installations, with cobot growth of 7 percent, below overall industrial robot market growth for the first time. At that scale, the useful question is no longer whether cobots work, but whether a given station fits, and that is what the assessment answers.
Where does the return come from in Nashville?
The return has three sources. The first is labor hours offset: repetitive stacking, loading, or tending that a person would otherwise do, which the cell repeats through a cycle without fatigue. The second is coverage: a cell can keep a station running through a stretch that is hard to staff. The third is steadiness: a cell holds the same cycle time and placement, which reduces rework on the product it touches.
Local conditions shape the first two. According to the Federal Reserve Bank of St. Louis, which publishes BLS data through FRED, the Nashville metro had 77.1 thousand jobs in transportation, warehousing, and utilities in December 2025, not seasonally adjusted. That is a large employer pool competing for the same kind of worker, and it is the sector where cells on packing and palletizing lines are most often placed.
The return is not about replacing a whole crew. A cobot cell covers one station, and the hours it can take depend on that station's cycle. Staff remain needed for changeovers, exception handling, and quality checks, so the savings range is built from the hours the cell can repeat, not from headcount reduction.
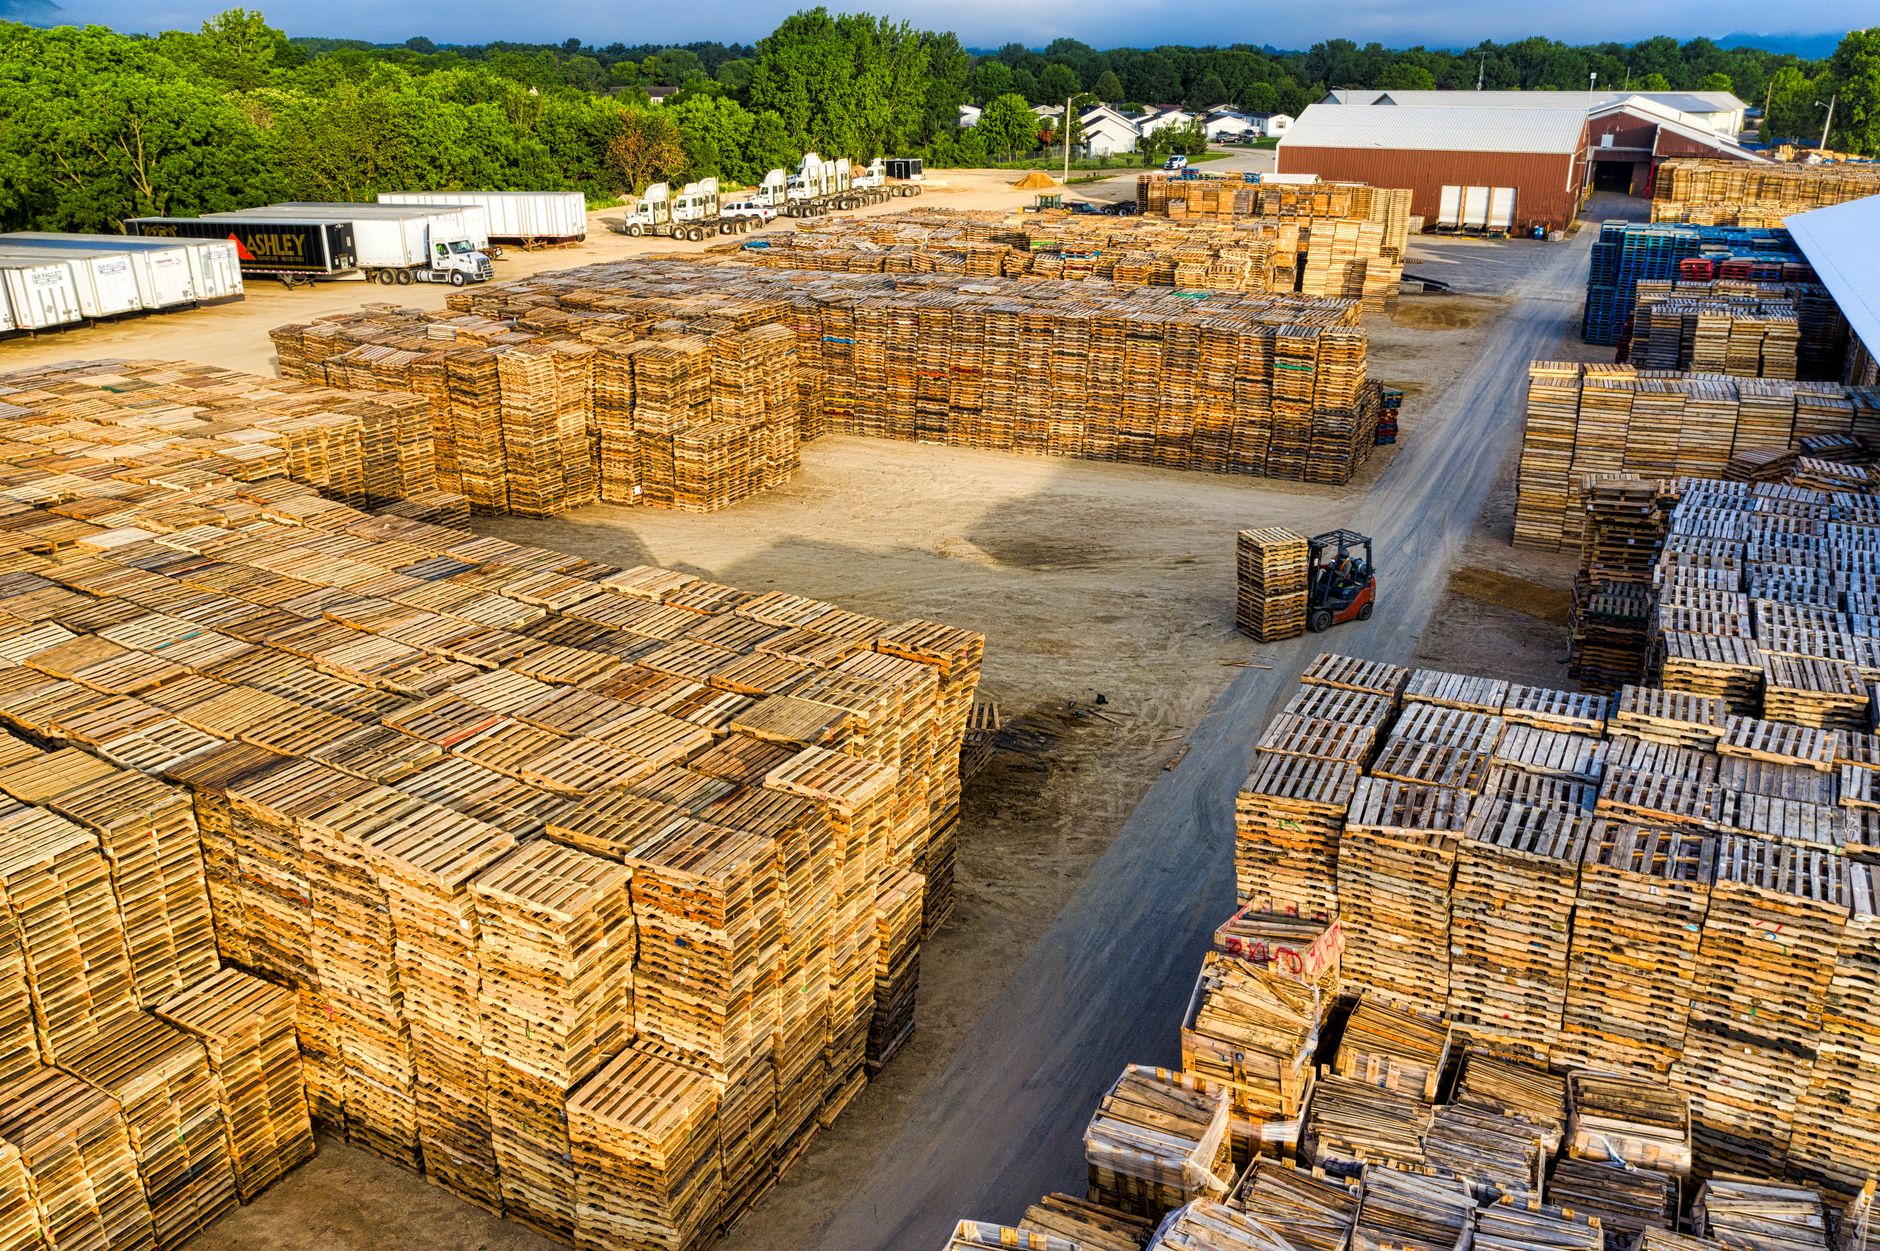
Median hourly wage, Laborers and Freight, Stock, and Material Movers, Hand
$4,427
Monthly cost of one full-time worker in Nashville, TN, at the median wage plus payroll costs (an estimate, not a quote).
How do you calculate cobot payback?
Start with the hours. For each station, count how many hours a week the laborers and freight, stock, and material movers, hand work takes there, then cut that figure to the share the cell can repeat within its reach and cycle. Multiply the remaining hours by the loaded hourly labor cost, which is the government wage for this job plus the employer costs added on top. The product is the gross labor offset for that station.
Subtract the lease cost next. The fixed robot lease payment is set in the quote after a site assessment, and the service cost is either included in the lease program or priced separately, depending on the terms. What remains is the savings range for that station. Run the math at a low, middle, and high share of reachable hours, because the assessment supports a range, not a single number.
Because a lease spreads the cost over its term, payback is the point where cumulative net offset turns positive after integration, deployment, and go live costs are counted. The table below shows the kind of hours the cell takes over, task by task, and why each row is measured rather than assumed.
What does the local labor side look like?
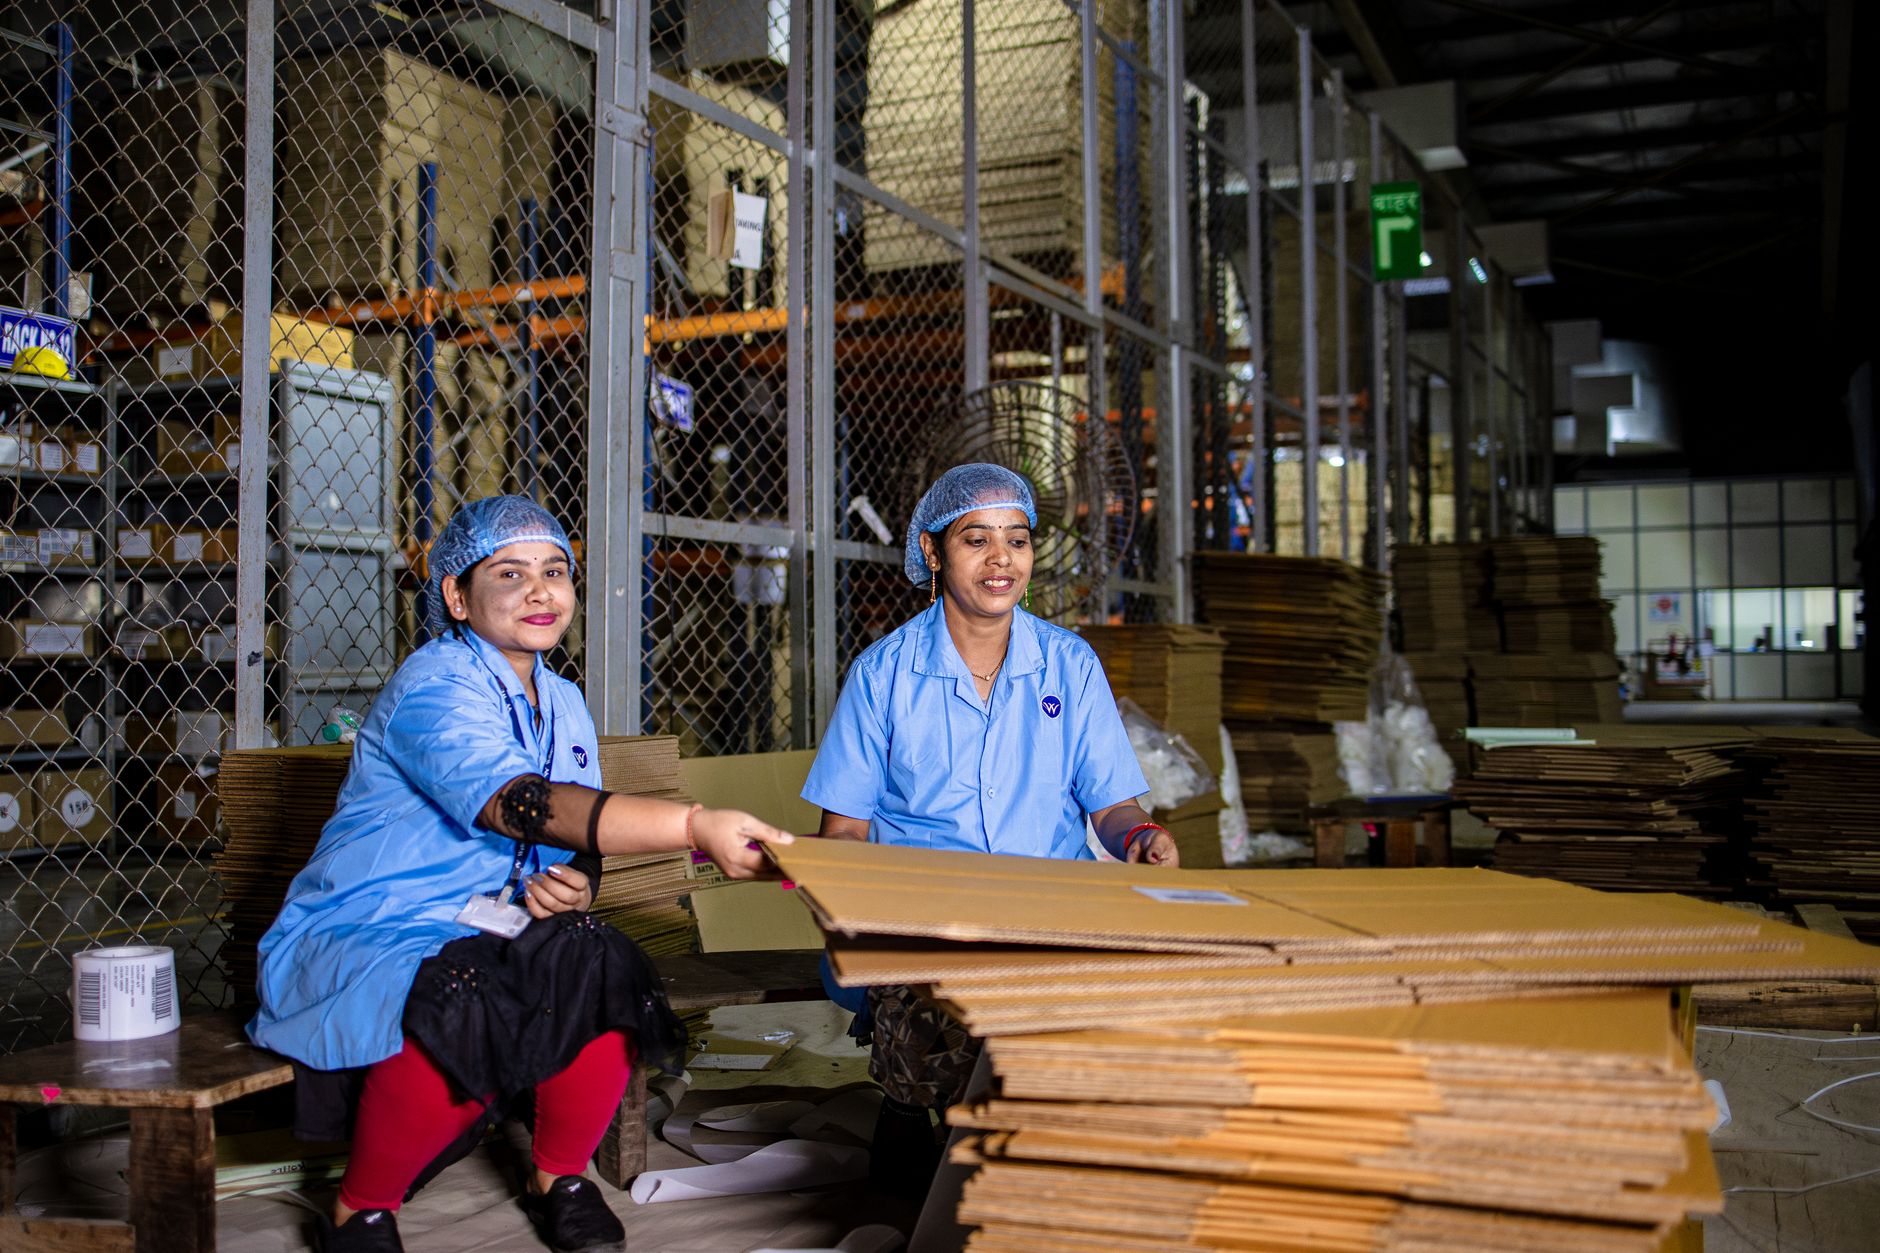
The government wage data on this page covers laborers and freight, stock, and material movers, hand in the Nashville metro for May 2024. Refer to the panel next to this text for the local wage for this job. According to the BLS Nashville release, the metro's mean hourly wage for all occupations sat below the national average that same year, so the local wage is a grounded baseline for cost math, not a premium rate.
Nationally, the detailed occupation had about 2,988,900 jobs in 2024, according to the BLS Occupational Outlook Handbook. The broader hand laborers and material movers group is projected to grow 4 percent from 2024 to 2034, so the pool of this work will keep competing for workers. This page does not quote a local job count for this exact occupation, because the figure we could check was not confirmed against the BLS table.
No public source we reviewed gives a verified site level headcount for this work, so this page does not state one. The site assessment counts the people on each station directly, and the offset is priced on the hours they spend on the work the cell can take.
What changes the number up or down?
The share of repetitive hours is the biggest lever. A station with a steady cycle, consistent case sizes, and a fixed reach gives the cell more hours to take. Mixed products, frequent changeovers, damaged loads, and irregular inputs reduce that share, and the savings range moves down with it.
Shift pattern is the next lever. A cell that runs two or three shifts spreads the lease over more productive hours, while a single shift leaves capacity idle. Turnover cuts the other way: a station with high quit rates carries recruiting and training costs that the assessment should count, though those costs are harder to verify than hours.
Turnover is a reason to take the hours seriously. According to a turnover analysis based on BLS JOLTS data, quit rates for transportation, warehousing, and utilities ran at 2.2 percent a month in 2025, against 2.0 percent for total nonfarm. Vendor estimates of annual warehouse turnover vary widely, so the assessment should use your own records rather than an industry average.
What are the risks to the return and how do you avoid them?
The main risk is overestimating reachable hours. A cell sized for the best day becomes a cell that sits partly idle on an ordinary one. Avoid this by timing the work across several weeks and several shifts before the quote is final, and by deciding on the low end of the range first.
The second risk is downtime. An idle cell offsets nothing, so the service plan matters as much as the arm. Maintenance included, on-site dispatch, remote triage, and spare unit coverage keep the cell running through faults. Ask for the response terms in writing before you sign, and confirm what happens during a repair.
The third risk is that the cell does not remove injury exposure on its own. According to the Bureau of Labor Statistics, transportation and material moving occupations had 835,040 cases involving days of job transfer or restriction across 2021 and 2022, the highest count among the major occupation groups, mostly from overexertion and bodily reaction. Those are older figures, but they show why the cell should reduce lifting, not just count hours. For all private industry, the total recordable case rate fell to 2.3 per 100 full-time equivalent workers in 2024, down from 2.4 in 2023, according to BLS, the lowest in that series since 2003.
- Repeat cycle without fatigue
Cobot
Holds the same cycle and placement across long runs
Staff
Slows and varies over a long shift
- Unusual, damaged, or irregular loads
Cobot
Struggles without setup or sensing, and often needs a person
Staff
Judges and adjusts on the spot
- Night and off-peak coverage
Cobot
Runs unattended only where the station is set up and monitored for it
Staff
Needs scheduling, hiring and supervision
- Changeovers and new products
Cobot
Needs reprogramming and fixture changes by trained staff
Staff
Adapts quickly with little setup
- Cost structure
Cobot
Fixed lease payment and service terms, set in the quote
Staff
Variable wages, benefits and turnover costs
- Quality checks
Cobot
Consistent placement, but output still needs staff inspection
Staff
Catches defects by eye and by touch
What does the timeline from assessment to payback look like?
The sequence runs from assessment to quote, then to installation, then to go live, then to measured payback. The assessment maps the floor and times the work. The quote follows with the fixed robot lease payment, the lease term, and the service terms. Integration and staff training come before go live, and go live support covers the first production runs.
Payback comes after measured hours, not on the day the cell is installed. The range you signed against is a forecast. The first months of logged cycles confirm or correct it, and that review sets the payback date you track. A figure given before measurement is an estimate, and we present it that way.
The timeline varies by site. Floor preparation, power, and staff scheduling set the pace more than the arm does, so the quote lists the dates for your building rather than a general schedule.
How do you get a precise figure from a free site assessment?
A free site assessment turns this page into a figure for your building. We map the station, time the laborers and freight, stock, and material movers, hand work across shifts, check reach and load types, and review your staffing records. Those inputs set the reachable share of hours and the savings range for each station.
The output is a lease quote after the assessment, with the fixed robot lease payment, the lease term, and the service terms written out. Compare it against your own labor hours, not against a generic figure. If the assessment shows a station does not fit, we say so, and that is a useful result too.
Bring four items to shorten the assessment: shift schedules, the station's current cycle, the product mix, and recent turnover records. Those inputs tighten the range before anyone walks the floor.
Who handles leasing, deployment and service?
We are a US commercial robot integrator. We pick the robot for the site, lease it through financing, deploy and integrate it, train the staff, and service it nationwide. One team handles the site choice, the lease program, go live, and the service plan, so the business does not coordinate several vendors for one station.
Service includes on-site dispatch and remote triage, with spare unit coverage available where the lease program offers it. The quote lists the lease term, the service terms, and what is covered, so the offset can be planned without surprises.
Frequently asked questions
Put a robot to work in Nashville.
We walk your site, learn the job, and recommend the unit that fits. Then we quote the lease, deploy it, and keep it serviced.
Sources
- US Bureau of Labor Statistics, Occupational Employment and Wage Statistics (OEWS May 2024)
- BLS Nashville metro occupational employment and wages release, May 2024
- FRED, Nashville MSA transportation, warehousing, and utilities employment (BLS data)
- BLS Occupational Outlook Handbook, hand laborers and material movers
- BLS injuries, illnesses, and fatalities, latest numbers
- BLS The Economics Daily, nonfatal injuries with days of job transfer or restriction, 1992 to 2022
- International Federation of Robotics, President's report
- Warehouse turnover analysis based on BLS JOLTS data