
The short answer
Cobot ROI in Oklahoma City comes from the repetitive handling hours that a leased collaborative robot takes over from people doing laborers and freight, stock, and material movers, hand type of work, plus coverage on shifts that are hard to staff. The result is a range rather than a fixed number, and it moves with how much of the work is repetitive, how many shifts the task runs, and how often the unit is up. A free site assessment measures those inputs and turns the range shown on this page into a quote for your floor.
Key takeaways
- The return comes from hours of repetitive handling work, not from removing a whole job.
- Savings are a range that moves with the share of the work a robot can realistically take.
- The local wage for this job sits in the government wage data panel, so the labor side can be traced.
- Lease terms are quoted only after a free site assessment.
- Downtime and poor task selection are the two risks that shrink the return most.
Run the numbers for your site
Auto-detected from your location - we use the real BLS wage here. Not right? Pick your city or state above.
What do you want to automate?
The cobot stacks the repetitive end-of-line pallets; your team handles changeover and QA.
What is cobot ROI in Oklahoma City?
Cobot ROI in Oklahoma City is the return a business earns from a collaborative robot arm that shares a work area with staff and takes over repetitive handling tasks, measured against the lease cost and the value of the hours removed. Collaborative arms are built to work near people, which is why they suit stations where a person and a machine share the same bench, conveyor exit or pallet position. According to the International Federation of Robotics, about five million robots now operate in factories globally, so the category is established and the real question is fit at a given site.
The labor side is valued on one occupation: laborers and freight, stock, and material movers, hand. The government wage data panel beside this text gives the local wage for that job in the Oklahoma City metro, drawn from the BLS OEWS estimates for May 2024, and every labor hour in the model is an hour of that work. Where the people in a building mainly do another job, the robot takes the laborers and freight, stock, and material movers, hand type of work off their plate, and that is the only labor the model counts.
The occupation is large nationally. According to the Bureau of Labor Statistics Occupational Outlook Handbook, the hand laborers and material movers group had about 6,950,000 jobs in 2024, with projected growth of 4% for 2024 to 2034, which the handbook lists as about as fast as average. The same page projects a change of 258,400 jobs, so the case for handling automation rests on hours and injury exposure, not on a shrinking workforce.
Where does the return come from in this setting?
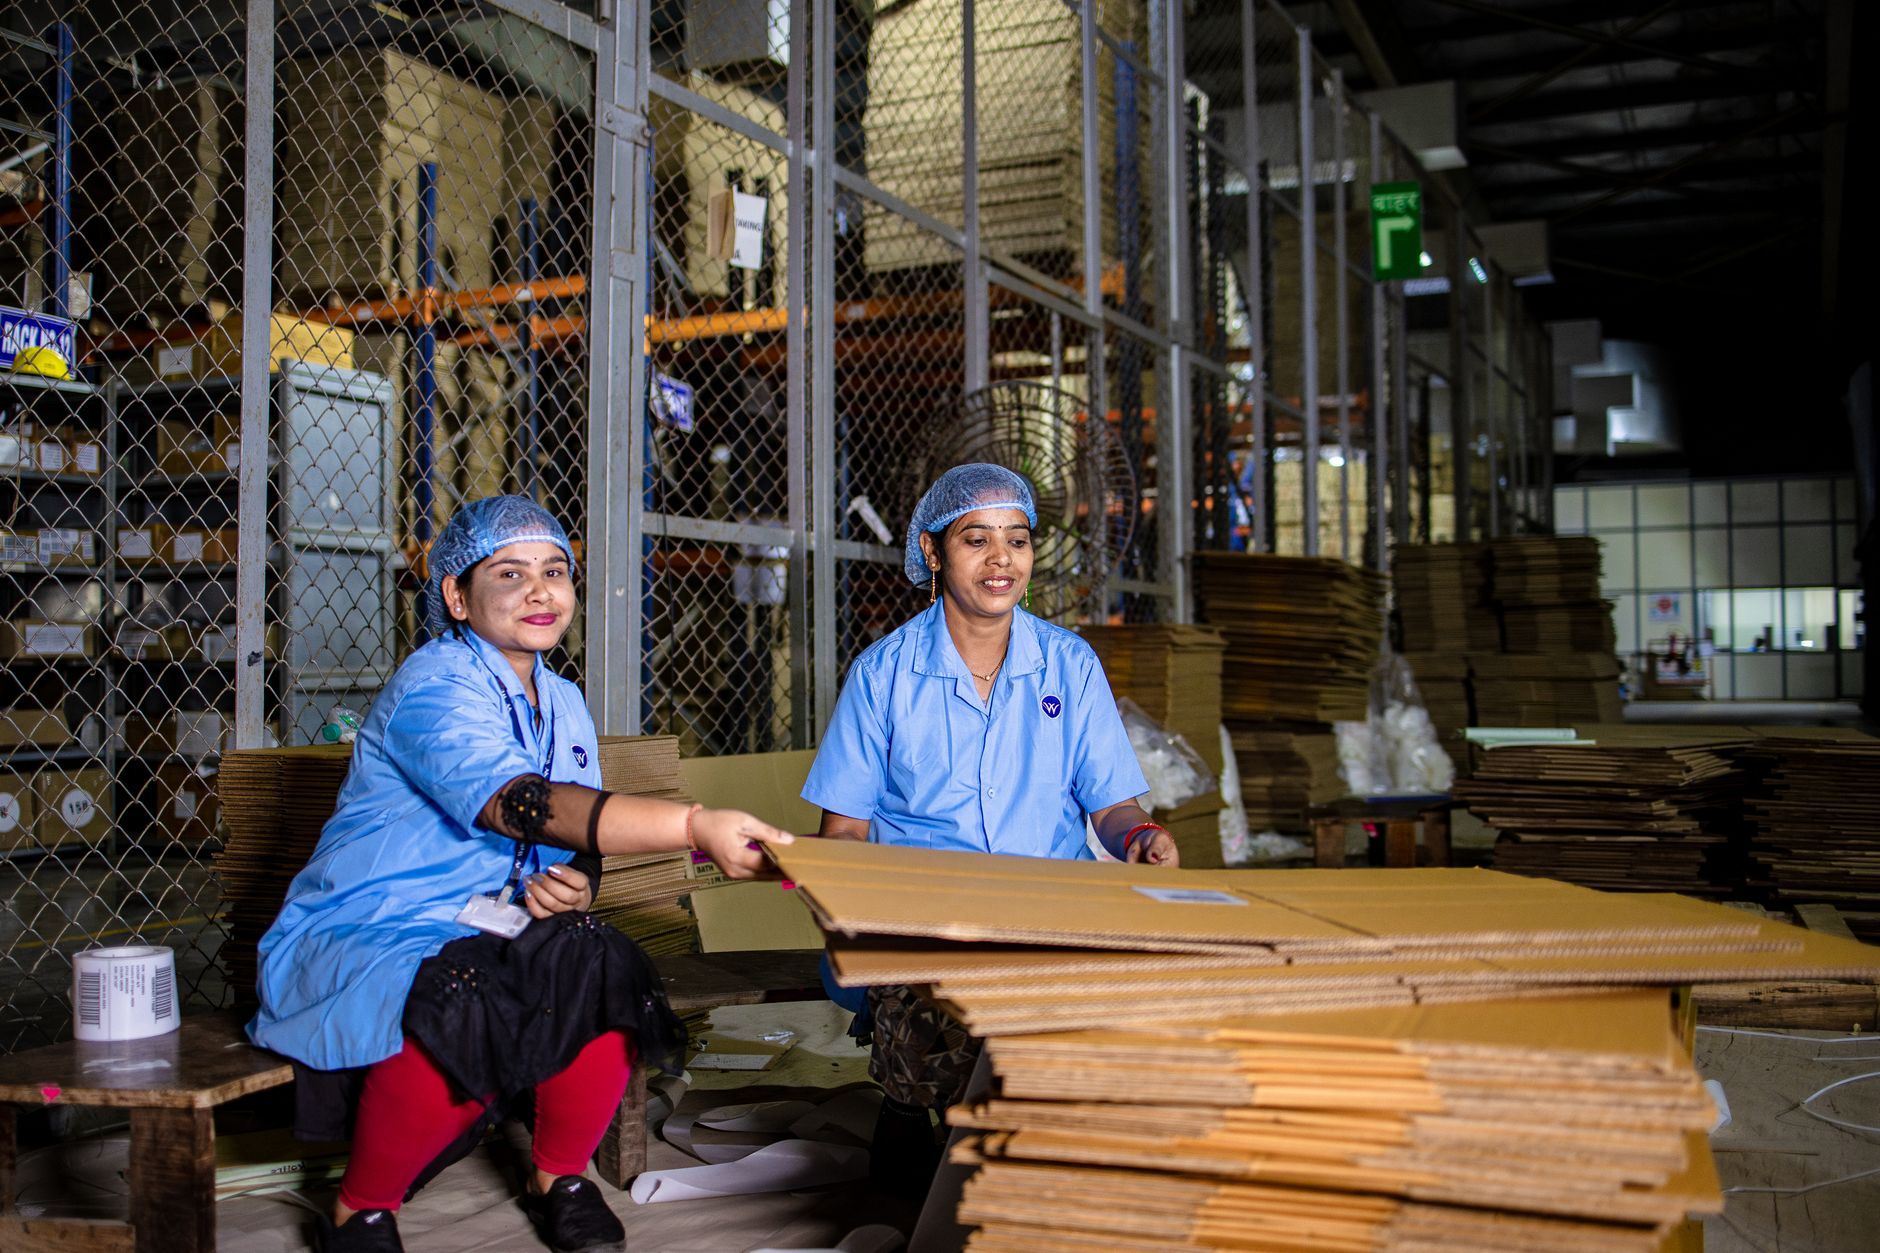
In a material handling operation the return comes from repetitive, bounded tasks: moving stock from a receiving point to a staging point, feeding cartons to a pallet, tending a conveyor exit, and clearing a station between batches. These motions are predictable, so a collaborative arm can run them without the judgment a receiver or a lead brings to the same work.
The second source is coverage. A robot can take the hours that are hardest to staff, such as early starts and the last hours of a shift, where open positions leave work to be done late or not done at all. That value is real but harder to pin to a line item, so the site assessment should time those hours separately before they are counted.
The third source is exposure. According to the BLS Occupational Outlook Handbook, hand laborers and freight, stock, and material movers, along with refuse and recyclable material collectors, have some of the highest rates of injuries and illnesses of all occupations. Taking repetitive loads off a person's hands reduces that exposure at the station, although this page does not put that reduction into the savings range.
Sector context helps too. FRED reports about 1,845.4 thousand employees in warehousing and storage in 2023, down from 1,915.3 thousand in 2022, and FRED flags a series break from 2023 data, so compare years with care before drawing a trend from them.
Median hourly wage, Laborers and Freight, Stock, and Material Movers, Hand
$4,079
Monthly cost of one full-time worker in Oklahoma City, OK, at the median wage plus payroll costs (an estimate, not a quote).
How does the cobot ROI math work?
The model starts with the hours of laborers and freight, stock, and material movers, hand type of work that happen in the robot's zone each week. It then applies the share of those hours a robot can realistically take over. That share is lower than the share that looks possible on a floor plan, because every task needs a reach, a grip, a path back and a clear handoff point that the cell can handle.
Those hours are valued at the local wage for the job, shown in the government wage data panel beside this text. The value of the hours removed is set against the lease cost quoted for your site, and the gap, tracked over the lease term, is the payback view. The range on this page is built from three inputs: the hours offset, the share of work the robot takes, and the quoted lease cost.
Lease term changes the shape of the return. A longer term spreads the lease cost over more shifts, but it also commits the site to one task for longer. A shorter term keeps the decision small while measured hours come in. Compare the terms in the quote against the hours you have timed, not against the best case.
A range is never a promise. It shows what a reasonable set of inputs produces. The site assessment replaces planning inputs with measured ones, starting with the actual hours a crew spends on the task and the number of cycles a shift produces.
What changes the number up or down?
Task fit is the biggest driver. A station with steady cycles and consistent part or carton sizes keeps the arm productive. A station where every load varies, or where a person makes a call on each item, gives the robot little to do, and the hours offset shrinks even if the arm is installed.
Utilization comes next. A unit that runs the task across two shifts returns more hours than one that runs a few hours a day with long idle periods. Uptime matters as well, since every hour the unit is down is an hour the crew covers by hand, and that offsets the saving for the same period.
Layout, integration effort and the lease term also move the number. Walk through the checklist below before you accept any range, and ask the assessment team to show which inputs drive the result.
Staffing context matters too. If the site already runs the task with a full crew and no open positions, the hours offset is about relief and consistency rather than a shift that is going unfilled. The number should reflect which of those situations the site is in.
Which hours does a cobot take off the floor?
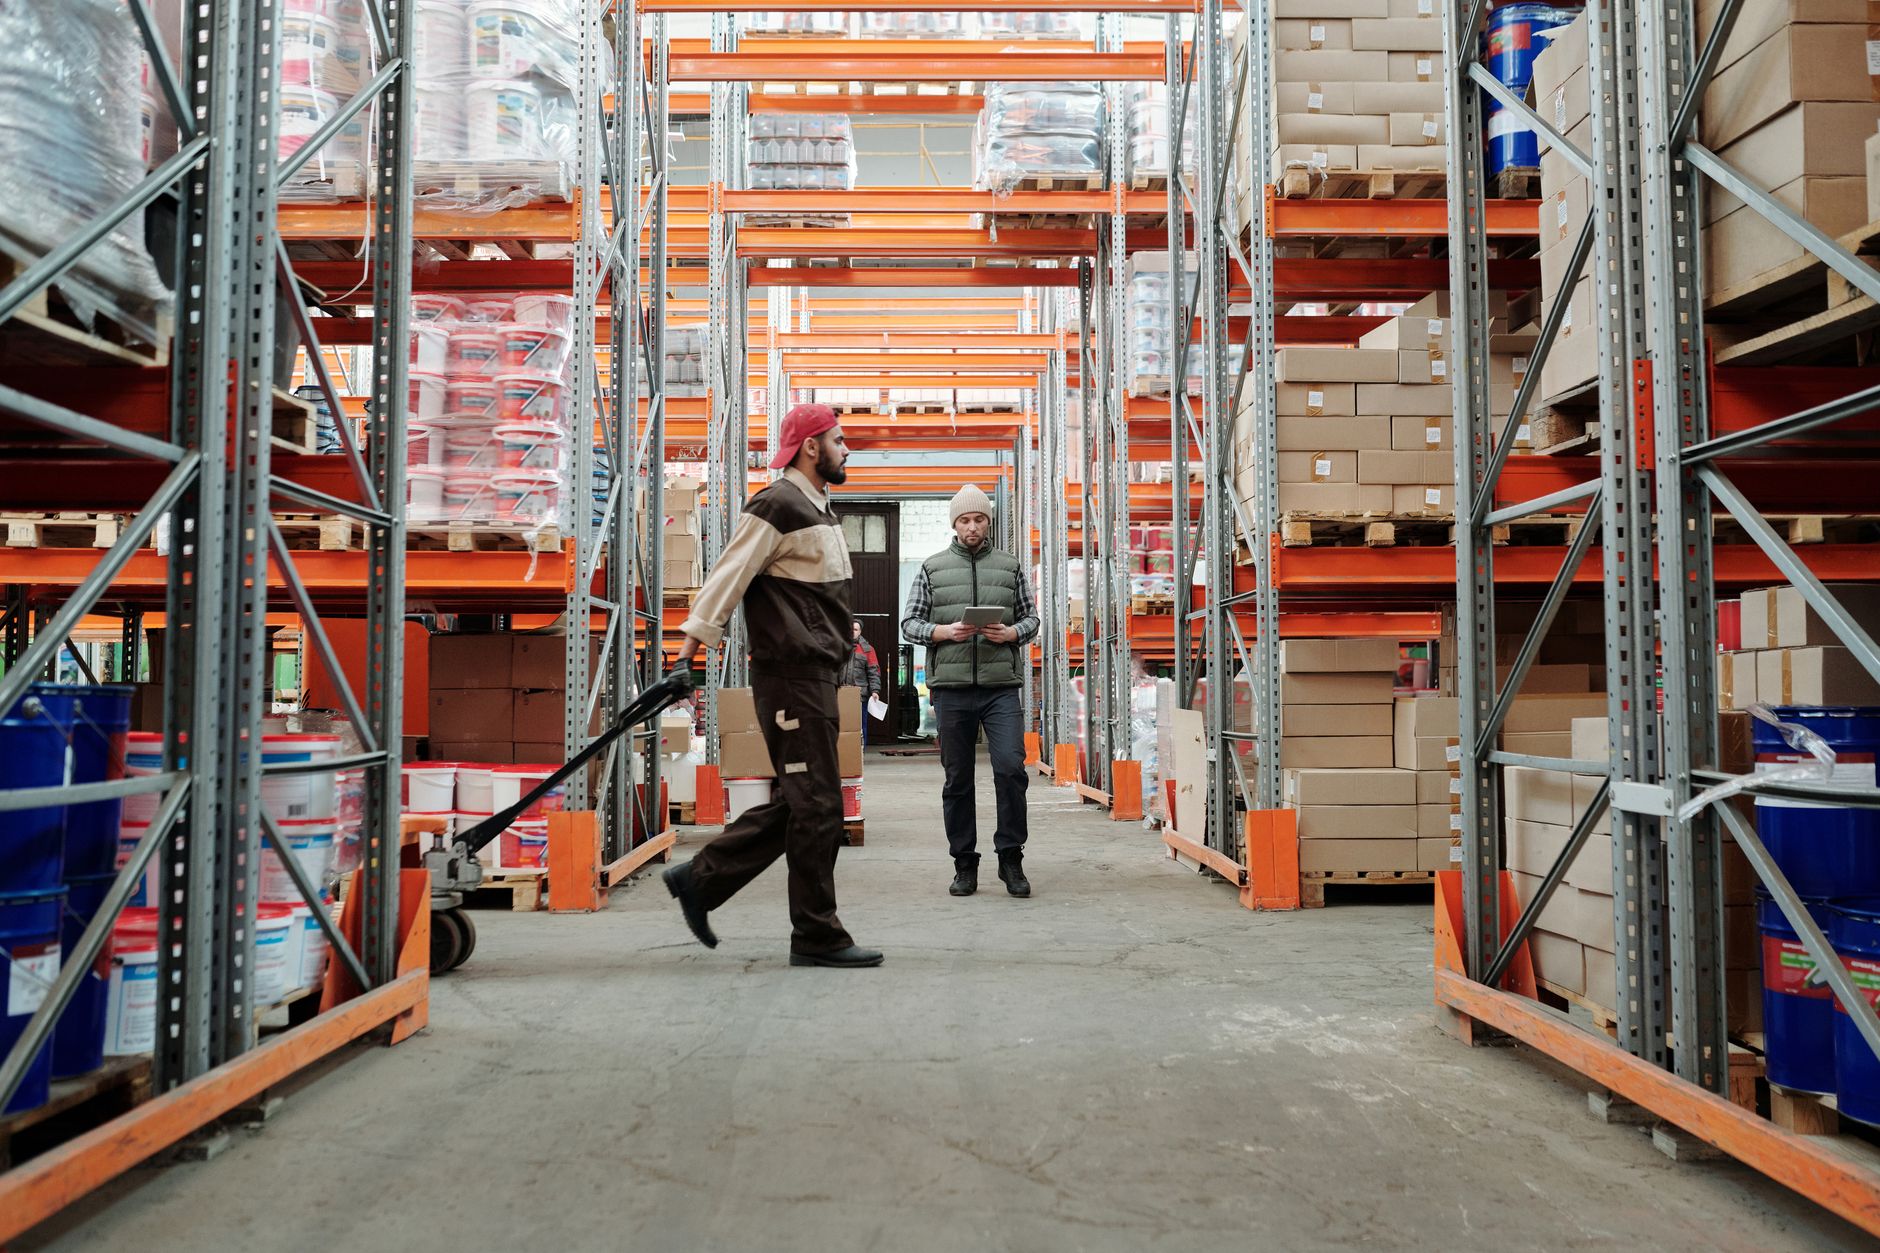
Hours are counted task by task, not estimated for a whole building. The table below lists the kinds of handling work collaborative arms commonly take, with the hours left for the site assessment to time. We do not publish hour figures for a site before walking it.
Staff keep the work that repetitive motion does not cover: exceptions, quality checks, changeovers and decisions about where stock goes. The schedule should be rebuilt around that split, not around a headcount cut the floor cannot absorb. This page assumes four people doing this kind of work at one site. That is a planning assumption, not a published count, and the assessment replaces it with your actual headcount.
Each row should be checked against the floor. A task that looks like a clean handoff on paper often has an exception every hour, and that exception decides whether the hours counted in the range are real.
What are the risks to the return and how do you avoid them?
The first risk is downtime. A collaborative arm that stops for a fault or a service visit pushes the crew back onto the task, and the saving drops for that period. Service coverage, remote triage and on-site dispatch keep that exposure small, and the response expectations should be written into the lease terms before signing.
The second risk is a poor task choice. A station with frequent exceptions produces a robot that stops often and a crew that still has to watch it. Start with one station that has clean, repeatable cycles, measure it for several weeks, and expand only after the numbers hold.
The third risk is an overstated plan. A range built on best-case utilization will disappoint. Ask that the range be rebuilt on measured hours, and ask what the number looks like if the unit runs at half the planned utilization.
Injury exposure is a business risk too. GAO, as summarized in a law-firm article, reported a serious injury and illness rate of 3.8 per 100 workers in transportation and warehousing for 2022, an older year than most other figures on this page. Service Robot Co. deploys, integrates, trains staff and services the unit nationwide, so the same team that sets the range also answers the downtime question.
What is a realistic timeline from assessment to payback?
The sequence runs in phases. A site assessment maps the floor and times the task. A quote follows for a lease with a fixed term. Deployment and integration come next, with staff training, and then a go-live period where the team checks measured hours against the plan. Payback arrives when the value of hours removed covers the lease cost to date, and that point moves with utilization.
Timing depends on site readiness more than on the robot itself. Power, floor condition, guarding and the staff schedule decide how fast the work starts. The assessment sets real dates rather than a generic schedule.
Service Robot Co. runs the assessment, deployment, integration, training and service as one engagement, with go-live support after handover. A phased start with one leased unit keeps the first decision small and gives the site measured hours before any wider rollout is considered.

How do you get an exact cobot ROI figure in Oklahoma City?
A precise figure comes from measurement. The free site assessment maps the work zone, times each task, counts cycles per shift and records the staffing that covers them. Those measurements replace the planning inputs used on this page.
The output is a quote for a lease with a fixed term, a savings range built on measured hours, and a deployment plan. The range is still a range, because real shifts vary, but it rests on what the floor actually does.
To prepare, bring the shift schedule for the work zone, the count of people on each task, and a note of the stations where errors or exceptions are most common. That gives the assessment a clean starting point.
Ask the assessment team to show the inputs behind the range: the hours timed, the share of cycles assumed to be robot-ready, and the utilization used. A range you can trace back to those inputs is easier to defend to finance than one you cannot.
Is a cobot better than staffing the same shifts?
The two are not interchangeable. People handle exceptions, judgment and changes in the work better than any arm. An arm holds a steady rate on a repeatable task, does not tire on a late shift, and does not need a new hire for each open position. The comparison below is candid about where each one wins.
For most sites the answer is a mix. The robot takes the repeatable part of the task, and the person keeps the part that needs judgment. The return is strongest where the repeatable part is large and the open shifts are hard to fill.
- Repeatable, bounded motion
Cobot
Holds a steady cycle across the shift
Staff
Works well but slows with fatigue on long or late shifts
- Exceptions and judgment
Cobot
Stops and alerts staff when a load falls outside its routine
Staff
Handles odd loads, damage and changes in the work
- Hard-to-fill shifts
Cobot
Runs the scheduled window once it is set up
Staff
Depends on hiring and turnover to cover the shift
- Start-up effort
Cobot
Needs site assessment, integration and training before go-live
Staff
Can start on the first day of hire, with onboarding
- Downtime
Cobot
Stops for faults and service visits, covered by service terms
Staff
Covers absence by calling in a backup, subject to availability
- Flexibility across tasks
Cobot
Best on the one station it was set up for
Staff
Moves across tasks and areas as the work changes
Frequently asked questions
Put a robot to work in Oklahoma City.
We walk your site, learn the job, and recommend the unit that fits. Then we quote the lease, deploy it, and keep it serviced.
Sources
- US Bureau of Labor Statistics, Occupational Employment and Wage Statistics (OEWS May 2024)
- Bureau of Labor Statistics, Occupational Outlook Handbook: Hand Laborers and Material Movers
- Bureau of Labor Statistics, OEWS: Laborers and Freight, Stock, and Material Movers, Hand (53-7062)
- International Federation of Robotics, President's report
- International Federation of Robotics, Five million robots now operate in factories globally
- Voxel AI, distribution center safety statistics (vendor-run, secondary)
- NatLawReview, GAO on OSHA ergonomic hazards in warehouses and delivery
- FRED, Warehousing and storage employment (NAICS 493)