
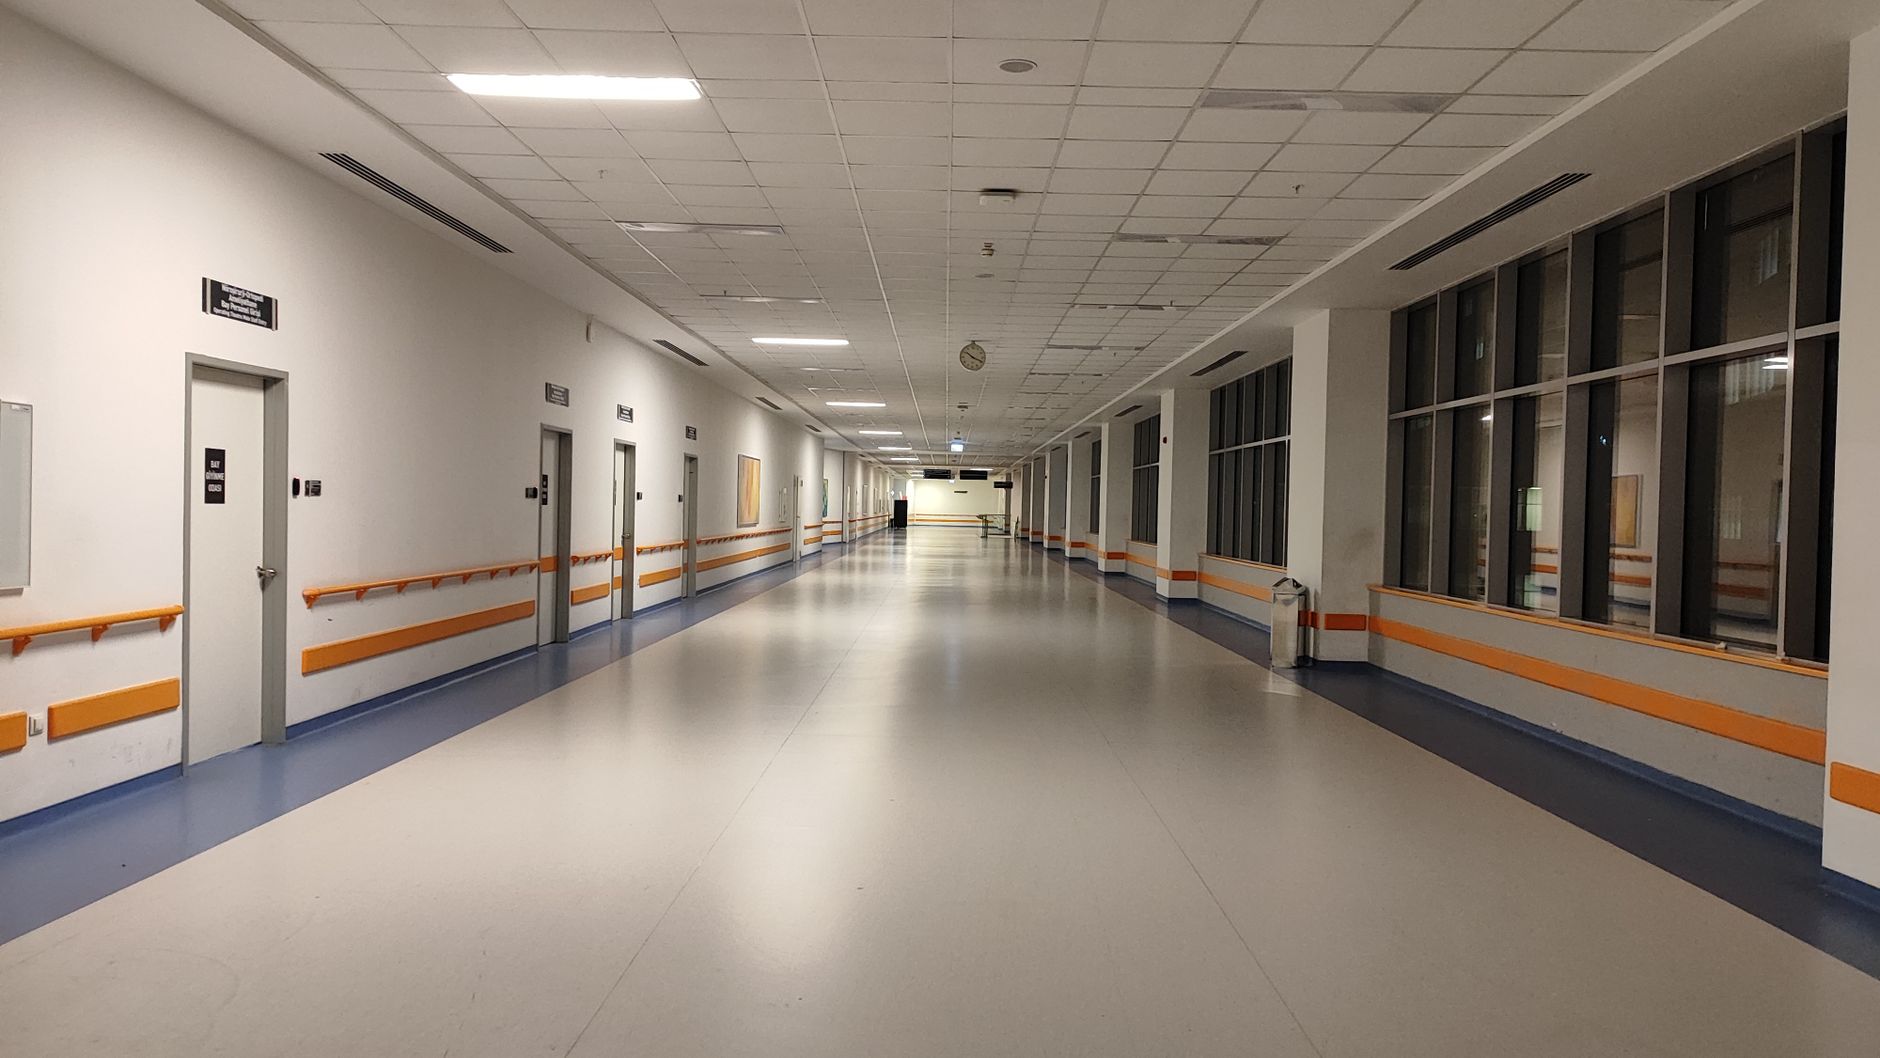
The short answer
Cleaning robot ROI in Milwaukee, WI is the labor value of the floor hours a robot takes over, minus the fixed lease payment and the staff time the robot still needs. The return is a range, and it depends on how much of the floor is routine, how many hours are scheduled, and how the building is laid out. A free site assessment turns that range into a lease quote for the actual building.
See what a cleaning robot costsRun the numbers in the ROI calculator
Key takeaways
- The return is the labor value of floor hours taken over, minus a fixed lease payment and supervision time.
- Routine floor passes move to a robot, while restrooms, spills and judgment calls stay with staff.
- Price the hours you have measured at the local wage for the job shown in the panel, not at guessed hours.
- Survey adoption is rising but uneven, so a pilot site should prove the hours before a wider rollout.
- A free site assessment is the only way to get a precise figure for your building.
Run the numbers for your site
Auto-detected from your location - we use the real BLS wage here. Not right? Pick your city or state above.
What do you want to automate?
The robot runs the open floor overnight; your crew keeps detail and edges.
What is cleaning robot ROI in Milwaukee, WI?
Cleaning robot ROI in Milwaukee, WI comes from three inputs: the floor hours a robot takes off staff, the local wage for the work those hours represent, and the fixed lease payment for the unit. The government wage data panel next to this text gives the local wage for janitors and building cleaners, which is the labor side of the math. The savings figure is a range, not a promise, because a robot covers part of a floor and part of a shift.
We are a US commercial robot integrator. We pick the robot that fits the site, lease it through financing, deploy and integrate it, train the staff who run it, and service it nationwide. The calculator on this page is pre-filled for Milwaukee, WI, and the range it shows is an estimate until a free site assessment confirms floor size, layout and schedule.
What does the local labor picture look like for this work?
According to the Bureau of Labor Statistics Occupational Outlook Handbook, janitors and building cleaners held about 2.4 million jobs in 2024. The same source projects employment change of 47,800 for 2024 to 2034, or 2 percent, which it describes as slower than average. Most openings are replacements: the handbook projects about 351,300 openings a year on average over the decade, mostly from workers who leave the occupation.
Turnover is the cost most sites feel first. When a cleaner leaves, the shift goes unfilled or gets covered by someone already busy, and the floor slips behind. A robot does not leave, but it also does not clean a restroom or move furniture, so it takes only the routine floor passes. The local wage for this job sits in the panel beside this text, and it applies to the hours that are actually routine.
Injury exposure is a second labor cost. According to the BLS Survey of Occupational Injuries and Illnesses, janitors and cleaners, except maids, logged 191.6 cases with days away from work per 10,000 full-time equivalent workers in 2020, up from 157.4 in 2019. In 2019 the all-occupations rate was 86.9. The calculator does not price injuries, but repeated heavy scrubbing is one of the exposures a site should weigh when it decides which hours to move.
Median hourly wage, Janitors and Building Cleaners
$4,060
Monthly cost of one full-time worker in Milwaukee, WI, at the median wage plus payroll costs (an estimate, not a quote).
Where does the return come from in this setting?
The return comes from floor hours that are routine, repeatable and scheduled. Most commercial floors have a few zones where the same work repeats every night: long corridors, open lobbies and stockroom aisles. Those hours are the ones a robot can take over. Detail work, spills and occupied rooms stay with staff, and keeping that split honest is what keeps the savings credible.
Adoption is rising, but the surveys disagree on how far. According to ISSA Today's September to October 2025 benchmarking survey, 43 percent of respondents reported plans for autonomous cleaning equipment, though that sample was facility management rather than building service contractors. An undated survey of building service contractors, sponsored by an equipment supplier, found that 68 percent answered no to implementing autonomous equipment, about 17 percent said no but were considering it, and under 9 percent said yes.
The gap between plans and use is not new. According to a 2019 baseline survey by AACEM and ISSA, sent to nearly 23,000 building service contractors, in-house providers and facility managers, active users were 27 percent of respondents. Interest is real, but an operator should expect to prove the hours at their own site rather than rely on what other operators plan to do.
- Overnight coverage
Cleaning Robot
Runs a mapped route without an operator once started
Staff
Needs a scheduled shift, a supervisor and a wage
- Consistency
Cleaning Robot
Repeats the same route and pass on every run
Staff
Varies with fatigue, staffing and the day's workload
- Restrooms and break rooms
Cleaning Robot
Does not do this detail work
Staff
Does this detail work
- Spills and irregular messes
Cleaning Robot
Flags the spot and pauses
Staff
Handles the spill on the spot
- Judgment about what is dirty
Cleaning Robot
Follows the mapped route and does not judge
Staff
Decides what needs more attention
- Staffing gaps
Cleaning Robot
Runs when the schedule runs, without a hiring cycle
Staff
A vacancy leaves the shift uncovered until filled
How do you calculate the payback?
The math has four inputs. The first is the floor hours per shift and per week that a robot would take over, taken from a site walk and the existing cleaning schedule. The second is the local wage for the job from the panel, applied to those hours. The third is the share of those hours a robot realistically takes, which is less than the whole block because staff still load, check and clear the route. The fourth is the fixed lease payment from the quote, plus the staff time needed to supervise.
Each period, the labor value of the hours taken over is compared with the lease payment and the supervision time. If the difference is positive, it counts toward the cost of getting started, including deployment, integration and training. Because the lease payment is fixed, the result is most sensitive to how many hours the robot really takes, not to small movements in the wage. The table below shows which tasks move, as a pattern rather than a count.
A worked check looks like this in practice. Take the measured routine hours per week, multiply by the local wage for the job from the panel, apply the share the robot realistically takes, then subtract the supervision time and compare the result with the lease quote. Run that check twice, once on a conservative share and once on an optimistic one, and the spread between the two is the range to present to the decision maker.
| Task | Today | With a robot |
|---|---|---|
| Scrub the main corridors | the longest block on the night crew route | a scheduled run, checked by staff at start and end |
| Sweep and scrub open lobby floors | a repeat pass before the building opens | an overnight run with no operator on site |
| Stockroom and storage aisles | a block of the shift on dusty floors | a night run, with staff clearing obstacles first |
| Restrooms and break rooms | hands-on work by staff | still done by staff |
| Spill response and exceptions | unplanned call-outs during the shift | still done by staff, with the robot paused |
The table shows which work moves, not how much. Hour counts for each row come from the site walk and the cleaning schedule, not from this page, and no typical hour count is claimed here.
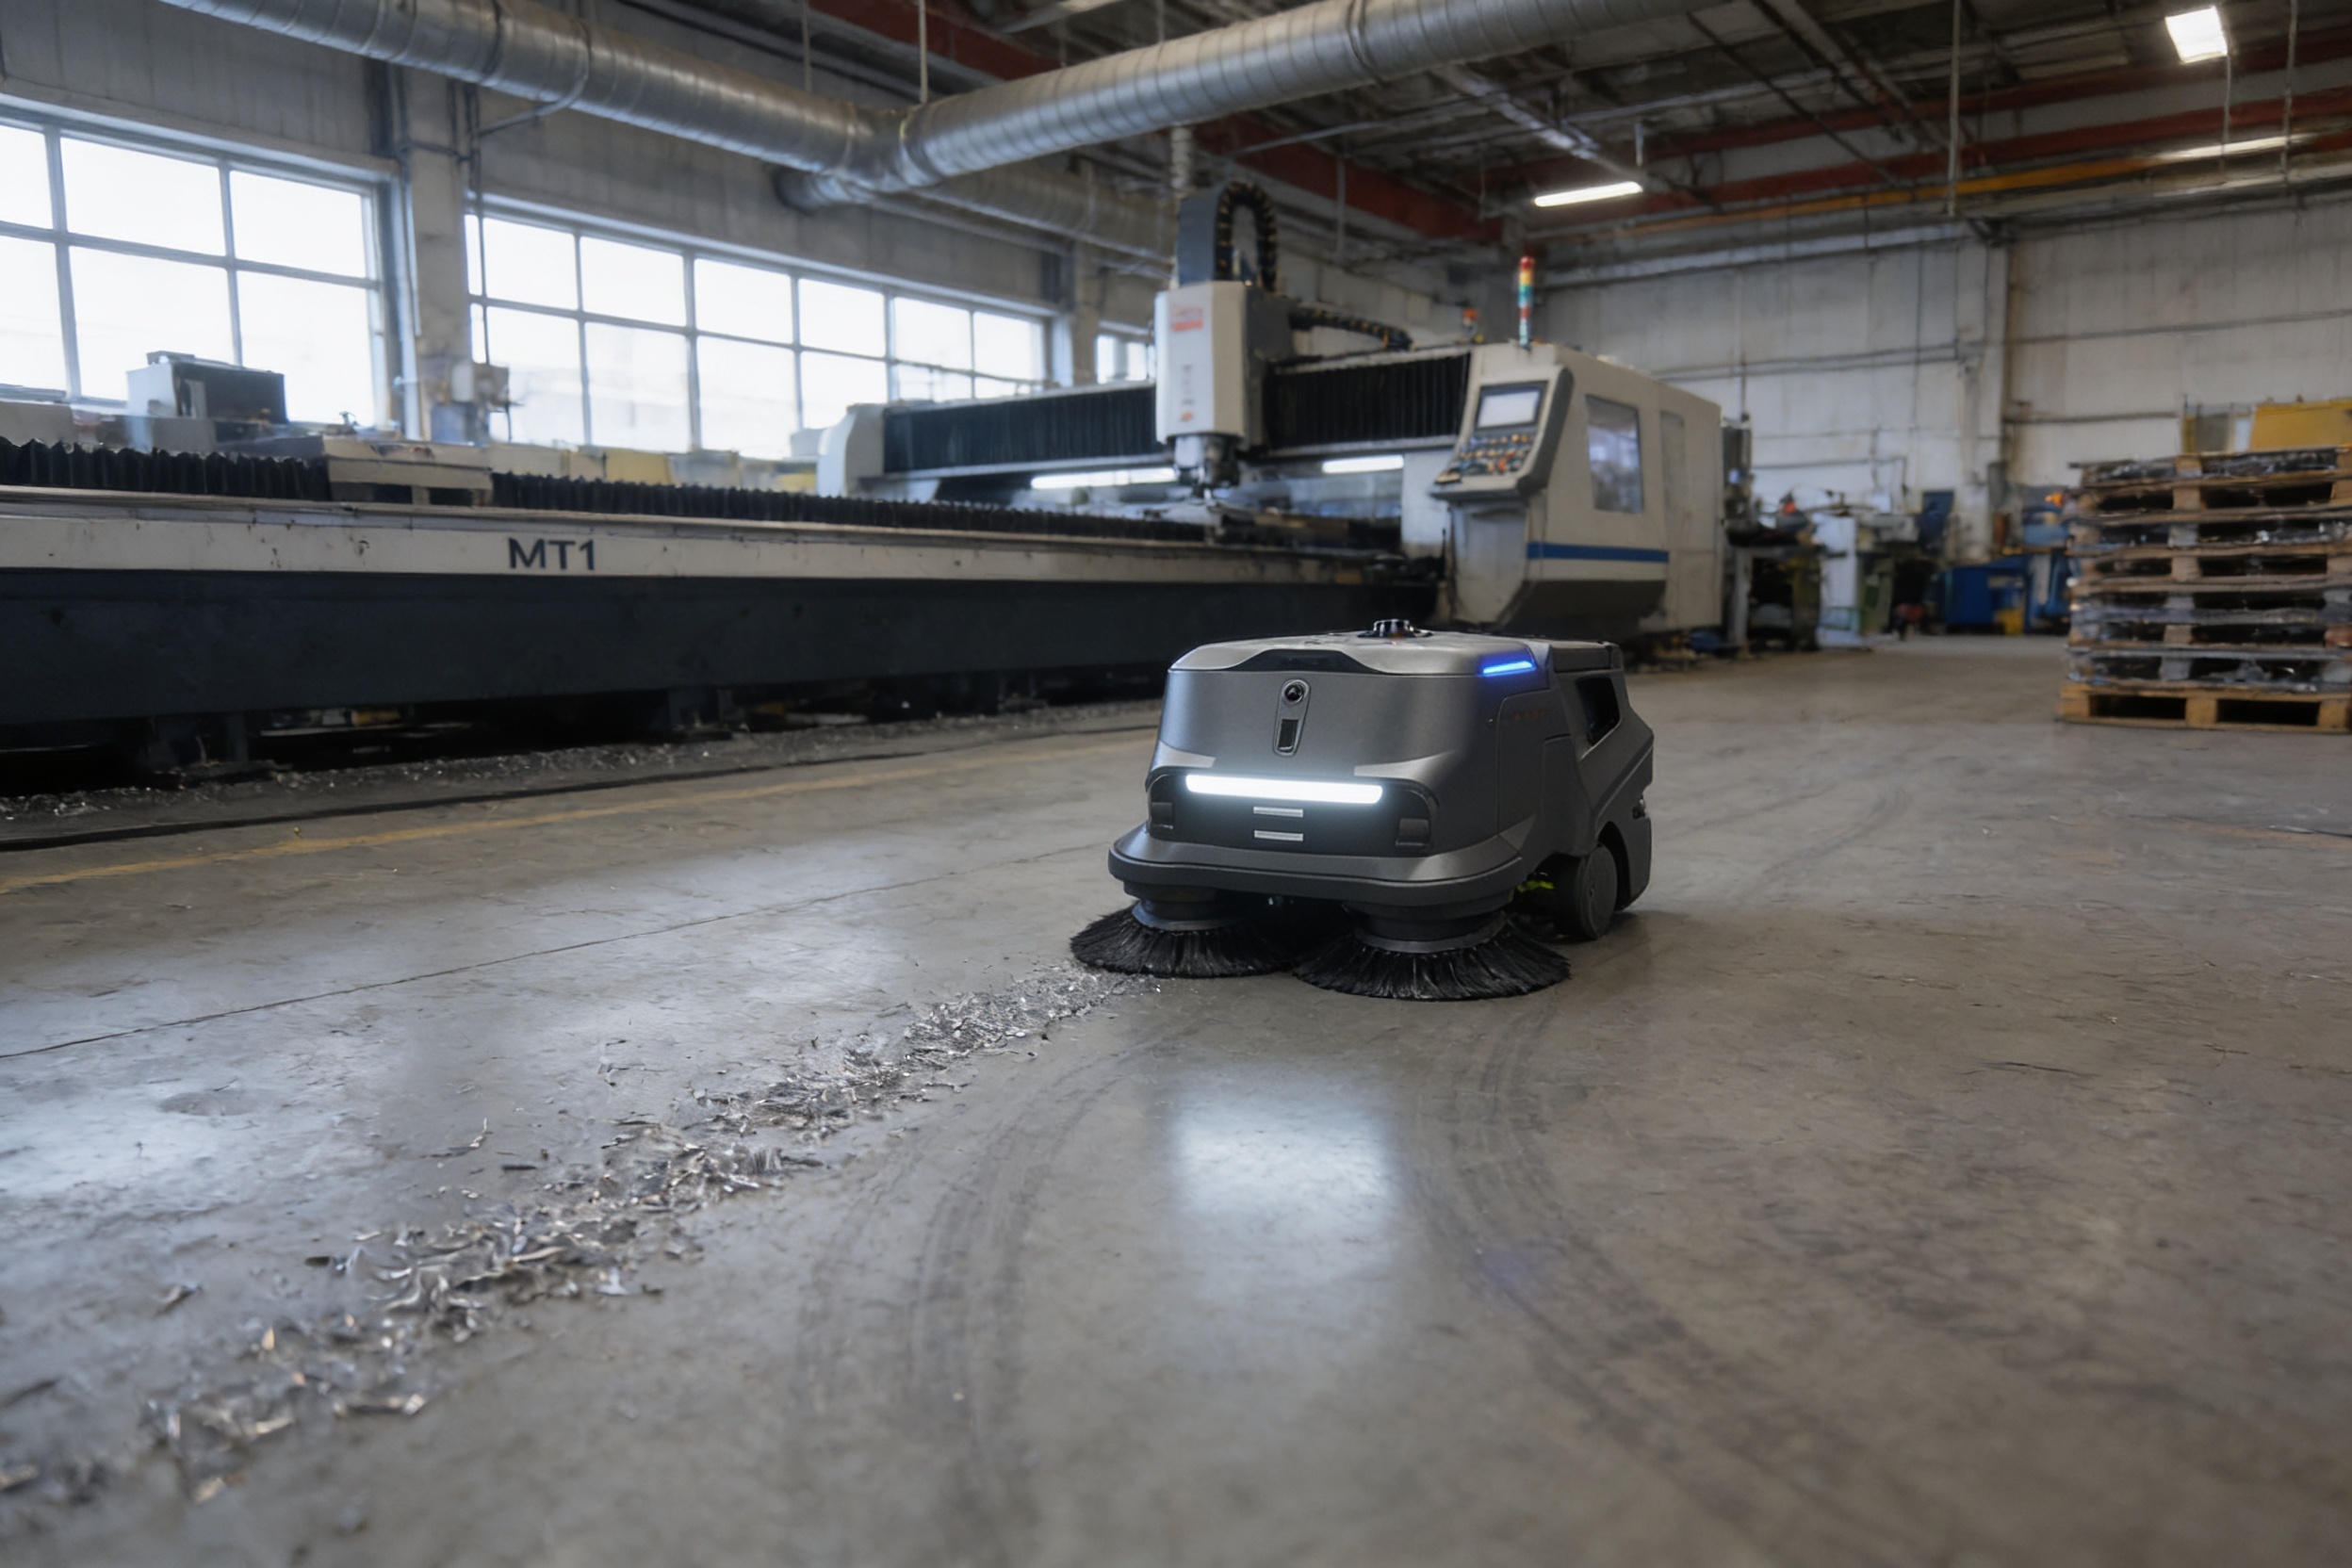
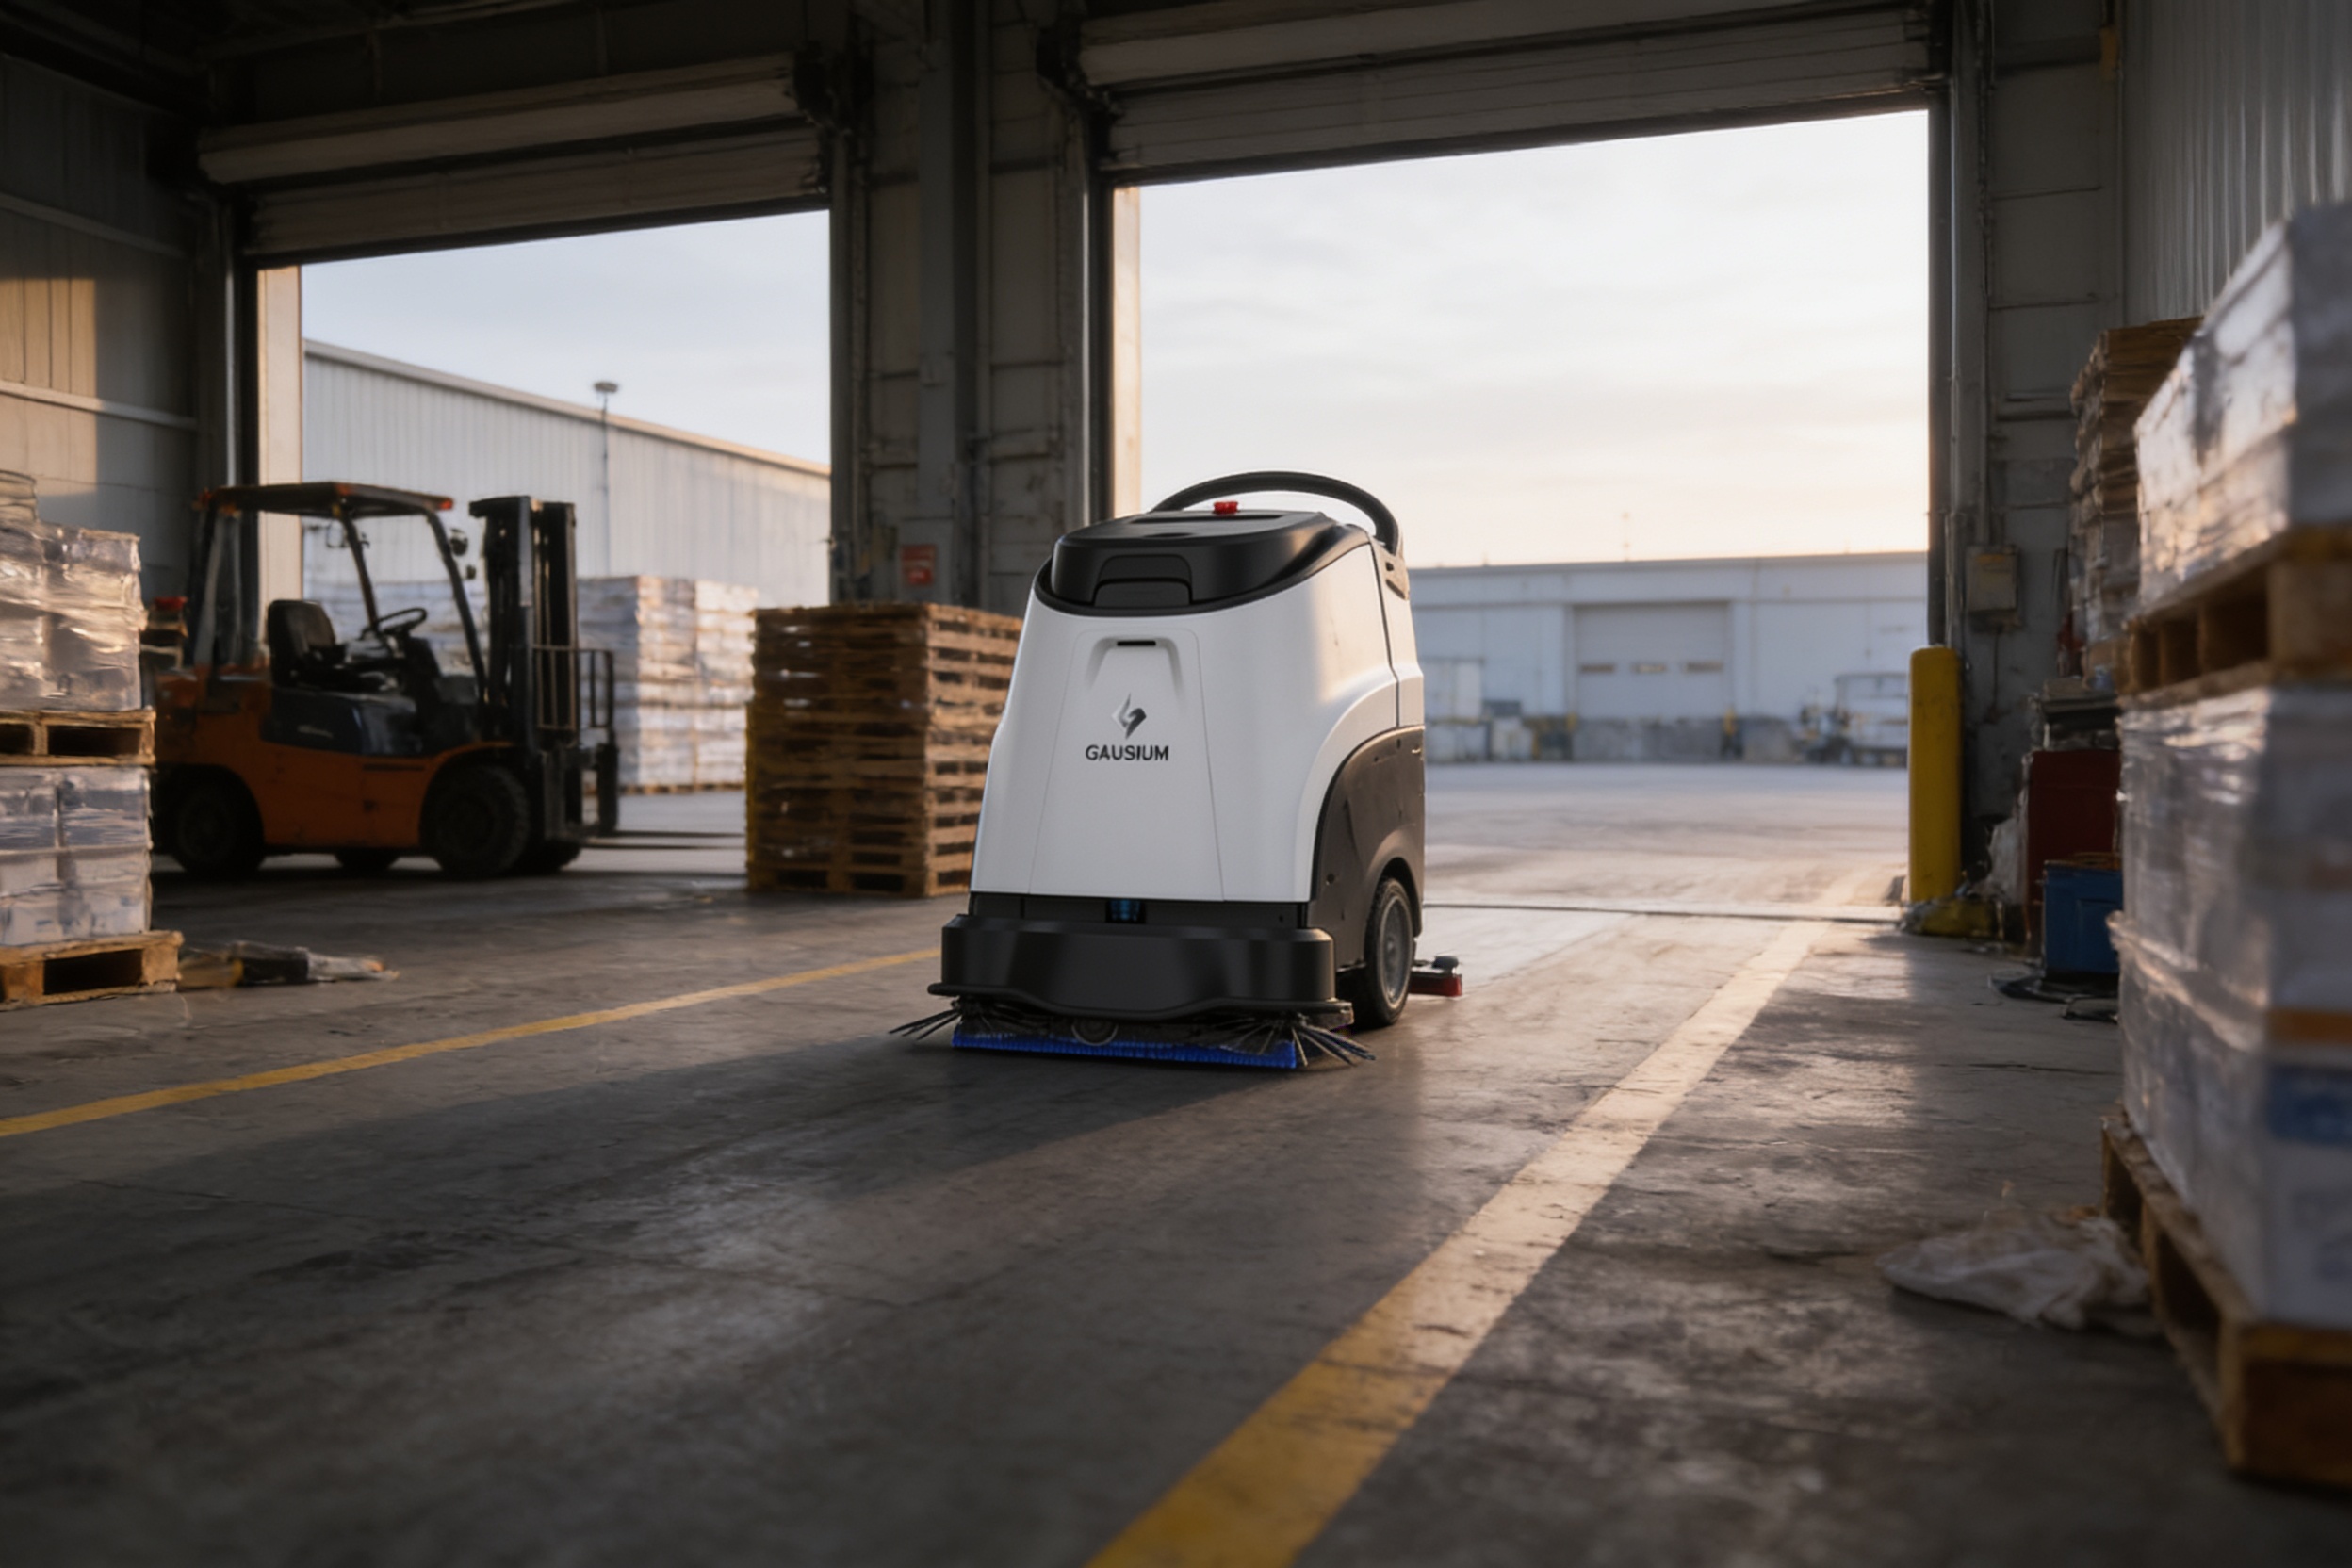
Which parts of a site does the robot cover?
A floor robot covers the open, repeatable parts of a building well and the rest poorly. It runs the long straight passes that staff repeat by hand, and it works best where the route can be mapped and kept clear. It does not do restroom detail, cannot lift or move furniture, and cannot handle the spill that appears in the middle of a shift.
The six zones below show where the robot works and where staff keep the work. Use them as the map for the site walk. A zone that is mostly stairs, clutter or occupied rooms will lower the return, so the assessment should mark those areas before any quote is written.
What changes the number up or down?
Four factors move the number most. A higher routine floor share raises the return, while a building full of detail work lowers it. Schedule matters, because a robot that runs while the building is empty uses floor time that would otherwise need a shift. Layout matters too, since tight doors, clutter and furniture cut run time and force manual clearing. Lease terms, including the service coverage in the quote, set the fixed cost side.
Two more factors belong on the checklist. Supervision time is often underestimated, because staff still start the run, watch for exceptions and handle the unit when it pauses. The number of sites also matters: a single pilot site tests the assumptions before a wider rollout, and the pilot data sets a realistic range for the rest.
What risks can erode the return, and how do you avoid them?
The most common risk is overestimating coverage. A site that assumes the robot will take every floor hour usually finds that restrooms, spills and exceptions still need staff time it had counted as saved. The fix is to measure the routine share during the assessment and to model the return on that measured share, not on total cleaning hours.
Downtime is the second risk. A unit out of service during a shift returns the work to staff, so the return depends on how fast service responds. A maintenance service plan, on-site dispatch when needed, remote triage for simple faults and spare unit coverage keep the schedule intact. Crew adoption is the third risk: staff who see the robot as a threat will not keep the route clear, so training and a clear division of work matter.
What is a realistic timeline from assessment to payback?
The sequence runs in a fixed order: site assessment and floor mapping, the lease quote, deployment and integration, staff training, go-live support, and a measurement period before any payback review. The calendar length depends on the site and any approvals it needs, so the assessment should set the dates. A phased start with one leased unit is the usual way to avoid shutting the building down.
Payback is judged on measured hours, not on the first week. Track the hours the robot runs, the staff time it still uses and the exceptions it creates over the measurement period. We deploy, integrate, train and service units nationwide, so the same team that sets the route also keeps the unit working through the period when the return is measured.

How do you get a precise figure from a free site assessment?
A free site assessment is the only way to turn this range into a precise figure. We map the floor, log the cleaning schedule, identify the routine zones and the exceptions, and confirm layout and traffic. The result is a lease quote with a fixed robot lease payment and the service terms, which is the number the return is measured against.
Prepare three things before the visit so the assessment moves quickly. Gather the cleaning schedule with the hours staff currently log, a floor plan with obstacles marked, and the local wage for the job from the panel, since that is the labor value the hours are priced on. Bring the list of tasks staff say are never routine, so the assessment can separate them from the work that moves.
Frequently asked questions
Upcoming events in Milwaukee, WI
Put a robot to work in Milwaukee.
We walk your site, learn the job, and recommend the unit that fits. Then we quote the lease, deploy it, and keep it serviced.
Sources
- US Bureau of Labor Statistics, Occupational Employment and Wage Statistics (OEWS May 2024)
- Bureau of Labor Statistics, Occupational Outlook Handbook: Janitors and Building Cleaners
- Bureau of Labor Statistics, Survey of Occupational Injuries and Illnesses: Janitors and Cleaners, 2016-20
- ISSA Today, September-October 2025 benchmarking survey
- AACEM and ISSA 2019 baseline survey
- Survey of building service contractors on autonomous equipment