

The short answer
Cobot ROI in Minneapolis comes mainly from repetitive handling hours, measured in the work of laborers and freight, stock, and material movers, hand, that a cobot takes over at a fixed station on each shift. The savings range on this page is a planning estimate, not a promise, and it depends on measured hours, the share of the task a cobot realistically takes, and the lease cost quoted after a free site assessment.
Key takeaways
- The return comes from repetitive hours that stop landing on staff, not from headcount cuts.
- The Minneapolis metro had 77,550 covered transportation and warehousing jobs in 2023, a large base for this work.
- Shift count and the share of work a cobot takes are the two inputs that most change the savings range.
- A cobot maker reports average payback of about six months, but that figure is vendor-reported, and your measured run rate sets the real date.
- A free site assessment turns the savings range into a lease quote built on your own measured hours.
Run the numbers for your site
Auto-detected from your location - we use the real BLS wage here. Not right? Pick your city or state above.
What do you want to automate?
The cobot stacks the repetitive end-of-line pallets; your team handles changeover and QA.
What return can a Minneapolis business expect from cobots?
For a Minneapolis business, cobot ROI is mostly a labor return. A cobot is a collaborative robot arm that works beside people, and it takes over the repetitive part of a job, such as palletizing at a fixed station, feeding a packing bench, or tending an inbound conveyor. The return is the hours of that work that stop landing on staff, not a cut in headcount, and it grows when the same cycle repeats on every shift.
Adoption is broad enough to compare options with numbers. According to the International Federation of Robotics, 66,000 new collaborative robot installations were recorded in 2025, or 11% of all industrial robot installations, and cobot segment growth slowed to 7%, below the industrial robot market for the first time since tracking began. A3 reports that North American robot orders rose 6.6% in 2025, with collaborative robots at 19.6% of total orders.
The practical question is not whether cobots work, but whether one fixed task on your floor has enough steady hours to justify a lease. The rest of this page shows how to measure that.
How big is the labor pool these robots work beside in Minneapolis?
The Minneapolis metro has a large transportation and warehousing base. According to Minnesota DEED's June 2024 spotlight, using 2023 data, the metro had 2,173 establishments and 77,550 covered jobs in the sector. Warehousing and storage held 91.5% of its statewide employment in the metro, and the metro held 67.7% of Minnesota's transportation and warehousing employment.
The same DEED data shows warehousing and storage added 4,728 jobs from 2019 to 2023, the largest gain of any subindustry in the sector in the metro. FRED, the Federal Reserve Bank of St. Louis, reports the metro's sector employment at about 77.08 thousand in December 2025, seasonally adjusted from BLS data. The two sources use different definitions, so read them as a direction, not a precise level.
Nationally, the Bureau of Labor Statistics counts about 2,988,900 people in laborers and freight, stock, and material movers, hand jobs in 2024, according to its Occupational Outlook Handbook. The labor side of this page is valued on that occupation, using the local wage shown in the government wage data panel beside this text.
No verified headcount for one site was found, so this page uses 36 as a planning figure. That is the metro's covered jobs divided by its establishments, rounded, and it counts every job type in the sector. The site assessment should replace it with a count of the staff who do the target task.
Median hourly wage, Laborers and Freight, Stock, and Material Movers, Hand
$5,209
Monthly cost of one full-time worker in Minneapolis, MN, at the median wage plus payroll costs (an estimate, not a quote).
Where does the return come from in a warehouse or distribution setting?
Most of the return sits in material movement that repeats the same action at the same place. Palletizing at a fixed station, feeding a packing bench, and tending an inbound conveyor are typical targets because the cycle is the same all shift. People keep the work that needs judgment, such as damaged freight, mixed loads, label problems, and anything outside the cycle.
Injury exposure is part of the case, though harder to measure. A vendor analysis of 2024 warehousing data reports 4.8 total recordable cases per 100 full-time workers in warehousing and storage, a DART rate of 4.1, and 32 fatal injuries in the sector, up from 28 in 2023. Those are vendor figures and the underlying BLS table was not checked, so confirm them against official tables before they go into a board deck.
Less repetitive handling can reduce strain on staff, but the site assessment should measure the specific motions before counting that benefit. Keep hours saved and injury exposure as separate lines in the case, so neither one is credited with the other's result.
| Task | Today | With a robot |
|---|---|---|
| Palletize at a fixed station | timed during site assessment | cobot builds the pallet, staff check the load and wrap it |
| Feed a packing or pick station | timed during site assessment | cobot presents items, staff verify and pack |
| Tend an inbound conveyor at a fixed point | timed during site assessment | cobot loads and clears the conveyor, staff monitor the queue |
| Clear exceptions and damaged freight | timed during site assessment | still done by staff |
| Reset the cell at shift change | timed during site assessment | short daily check and reset by a trained operator |
No hour figures were verified for this type of site. The today column is filled during the free site assessment from timed observation over several shifts, so this table lists tasks, not hours.
How does the savings math work?
The basic math has four inputs. Start with the hours per week the target task takes in laborers and freight, stock, and material movers, hand time, and multiply by the share a cobot realistically takes. Value those hours at the local wage for this job from the government wage data panel, then subtract the lease cost and the staff time needed to supervise and reset the cell. What remains is the savings range for that site.
The share is the input most often overstated. A cobot does not take the whole task, because exceptions, restocking the feed, clearing a jam, and layout changes stay with people. Model a conservative share and an optimistic one, and let the range span both. The lease cost arrives as a fixed robot lease payment in a quote after a free site assessment, so that side of the math is predictable once it is in writing.
- Repeating the same cycle
Cobot
Holds the same pace on every cycle of the shift
Staff
Pace drops late in long shifts, and rotation takes time
- Exceptions and damaged freight
Cobot
Stops and flags the item, cannot judge it
Staff
Judges, reroutes, and documents the problem
- Layout or product changes
Cobot
Needs reprogramming and sometimes fixture changes
Staff
Adapts the same day with no setup
- Coverage when staff are short
Cobot
Keeps running on a set cycle while the cell is fed
Staff
Coverage depends on who is on the shift
- Staffing changes
Cobot
Stays productive through staff turnover, though the operator needs training
Staff
Each new hire needs training on the task
- Cost structure
Cobot
Fixed robot lease payment plus service
Staff
Hourly labor that rises with hours worked and training
What changes the number up or down?
Shift count is the largest lever. A cell that runs two shifts gives the cobot roughly twice the working hours of a single shift cell, as long as the feed of work keeps pace. Utilization is the second lever. A station that waits on inbound freight for half the day returns about half its potential, so layout and the flow of work set the outcome as much as the machine does.
Labor conditions move the case too. NELP reports 124% turnover at New Jersey Amazon warehouses in 2020, a single company in an earlier year, so it does not describe Minneapolis. No authoritative 2025 survey of warehouse worker turnover was found, so the site's own turnover records are the better input. Higher turnover raises the value of a cell that does not depend on one experienced picker, but it also raises the training load on the staff who supervise it.
What are the risks to the return and how do you avoid them?
The main risk is a cell that sits idle because the work was never steady. Before committing, confirm the target task repeats on a fixed cycle with a known volume. The second risk is integration cost. A cell that needs fixtures, conveyor changes, or floor work takes longer to pay back than a plain station, so scope that work into the quote at the start.
The third risk is downtime. A stopped cobot returns nothing, and the work falls back on the staff who were supposed to be freed. Ask how repair works, how fast a technician reaches the site, whether remote triage clears faults first, and whether a backup unit is available. We dispatch technicians nationwide and triage faults remotely, and any provider should answer these questions in writing.
Watch scope creep as well. A cell that starts on one task often grows into three. That can be the right move, but each added task should pass the same measured-hours test as the first.
How long does it take from assessment to payback?
A realistic timeline runs in four stages: site assessment and mapping, quote and lease agreement, deployment and integration with go live support, and a measured run period before savings are counted. The first three move quickly on a simple cell and slowly on a complex one. Ask for a dated plan for each stage rather than a single payback date.
The public payback figures come from vendors. A cobot maker's customer blog reports an average payback of about six months, but that figure is vendor-reported. No independent survey of cobot payback periods turned up in the research, so the number to trust is your own measured run rate after go live.
Track real hours for at least one full cycle of the work, not a best week. The payback date moves with actual run rate, so the record matters more than the forecast.
How do you get a precise figure from a free site assessment?

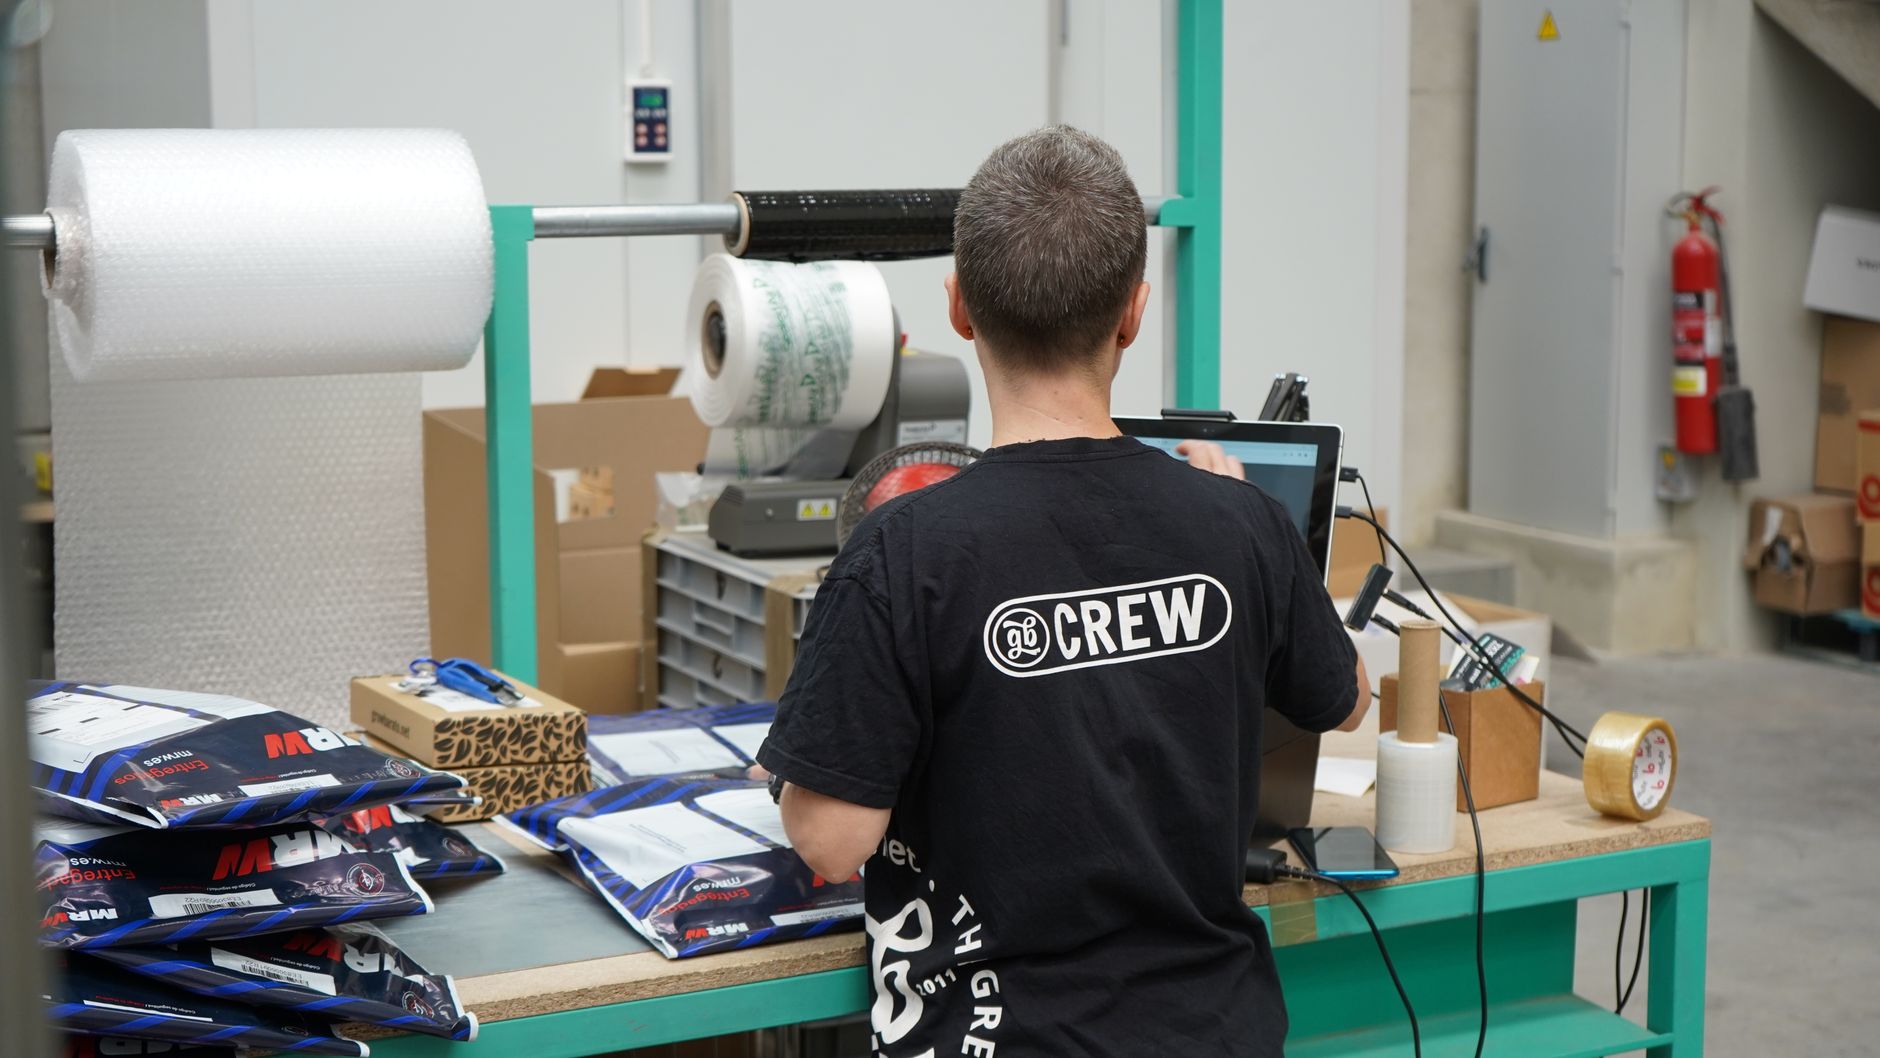
A free site assessment replaces estimates with measurements. We map the floor, time the target task over several shifts, record the hours of laborers and freight, stock, and material movers, hand work, and check the layout for integration needs. The output is a savings range built on those measurements, plus a lease quote covering the robot, financing, deployment, and service.
Bring the records you already have: shift schedules, daily volume, case or pallet counts, and staff hours booked to the task. The better the inputs, the narrower the range. A precise figure needs a measured share of the work, and the assessment is where that share gets measured rather than assumed.
Use the savings range shown with this page as a starting point. The calculator is pre-filled for Minneapolis, MN, and shows a range, not a promise. Swap in your measured numbers as soon as the assessment provides them.
Frequently asked questions
Upcoming events in Minneapolis, MN
Put a robot to work in Minneapolis.
We walk your site, learn the job, and recommend the unit that fits. Then we quote the lease, deploy it, and keep it serviced.
Sources
- US Bureau of Labor Statistics, Occupational Employment and Wage Statistics (OEWS May 2024)
- U.S. Bureau of Labor Statistics, Occupational Outlook Handbook: Hand Laborers and Material Movers
- Minnesota DEED, June 2024 spotlight (2023 data)
- FRED, Federal Reserve Bank of St. Louis (BLS data, seasonally adjusted)
- International Federation of Robotics, 2025 data (President's report)
- A3, 2025 North American robot orders (press release)
- National Employment Law Project, Amazon New Jersey turnover data brief
- Vendor analysis of 2024 warehouse injury statistics
- Cobot manufacturer customer blog (vendor-reported payback)