
The short answer
Autonomous forklift ROI in Minneapolis, MN comes mainly from taking over the repetitive pallet moves that laborers and freight, stock, and material movers, hand staff would otherwise do, and from covering shifts that go unfilled. The savings range is set by the share of those hours a robot can realistically take, weighed against a fixed lease payment and the supervision that remains, so a free site assessment narrows the result for your floor. Treat it as a question of measured hours, not a single fixed number.
See what a autonomous forklift costsRun the numbers in the ROI calculator
Key takeaways
- The return comes from the pallet moves a robot takes over, not from a flat headcount cut.
- The metro had about 36,880 people in this job in May 2023, according to the BLS area table.
- The share of hours a robot realistically takes is the largest swing in the savings range.
- Forklift work carries serious injury risk, and NSC counted 84 worker deaths involving forklifts in 2024.
- A free site assessment turns the range into a figure for your floor and your lease.
Run the numbers for your site
Auto-detected from your location - we use the real BLS wage here. Not right? Pick your city or state above.
What do you want to automate?
The robot takes the repetitive cart and pallet moves off the heaviest motion.
What is autonomous forklift ROI in Minneapolis?
Autonomous forklift ROI in Minneapolis is the return a business gets when an autonomous forklift takes over part of the pallet and freight work that people would otherwise do, measured against the fixed lease payment and the supervision the robot still needs. The return does not come from a single headline. It comes from hours: the hours of laborers and freight, stock, and material movers, hand type of work that move off staff, multiplied by the share of those hours a robot can realistically handle on your floor.
The government wage data on this page gives the local wage for this job, and the savings range is priced on that wage. The calculator therefore counts hours of laborers and freight, stock, and material movers, hand type of work, not the time of anyone else. Forklift operators in many buildings belong to another job, so where they run the machines the robot takes the laborers and freight, stock, and material movers, hand type of work off their plate, and the range does not price their time.
Why is Minneapolis a useful place to model this?
The Minneapolis-St. Paul-Bloomington, MN-WI metro had about 36,880 people employed as Laborers and Freight, Stock, and Material Movers, Hand in May 2023, according to the BLS Occupational Employment and Wage Statistics area table. The same table series showed about 35,780 for May 2022. We did not confirm a May 2024 metro employment count in this research, so the most recent count here is the May 2023 release.
A deep local pool makes staffing easier, but it does not make the work less repetitive. The return from a robot comes from the hours it takes over, so the local count matters mainly as a sign of how much this kind of work happens in the region. The number of people in the job does not tell you how many of those hours sit on your floor, which is why the assessment measures your own lanes. Dock hours, cold storage areas and seasonal peaks change the shape of the work, and the assessment records them.
Adoption is still early across the sector. Peerless Research Group's 2025 Industry Outlook, published by Modern Materials Handling, reports that about 10 percent of companies use AGVs or AMRs, and 30 percent plan to evaluate them within one to two years, from a sample of 110 qualified respondents. A study by Vecna Robotics and CITE Research, commissioned by the vendor from more than 1,000 professionals, found that 76 percent of companies had never deployed an AGV. These figures cover automated vehicles in general, not forklifts alone.
Median hourly wage, Laborers and Freight, Stock, and Material Movers, Hand
$5,209
Monthly cost of one full-time worker in Minneapolis, MN, at the median wage plus payroll costs (an estimate, not a quote).
Where do the labor hours come from in a warehouse?
The Census County Business Patterns count, as reported by a commercial data site, lists 21,521 warehousing and storage establishments with paid employees for 2023. That site did not verify the figure against Census, so use it as a directional count of how widespread this kind of operation is, not as an exact total. The number signals that pallet handling is a common daily task across the country.
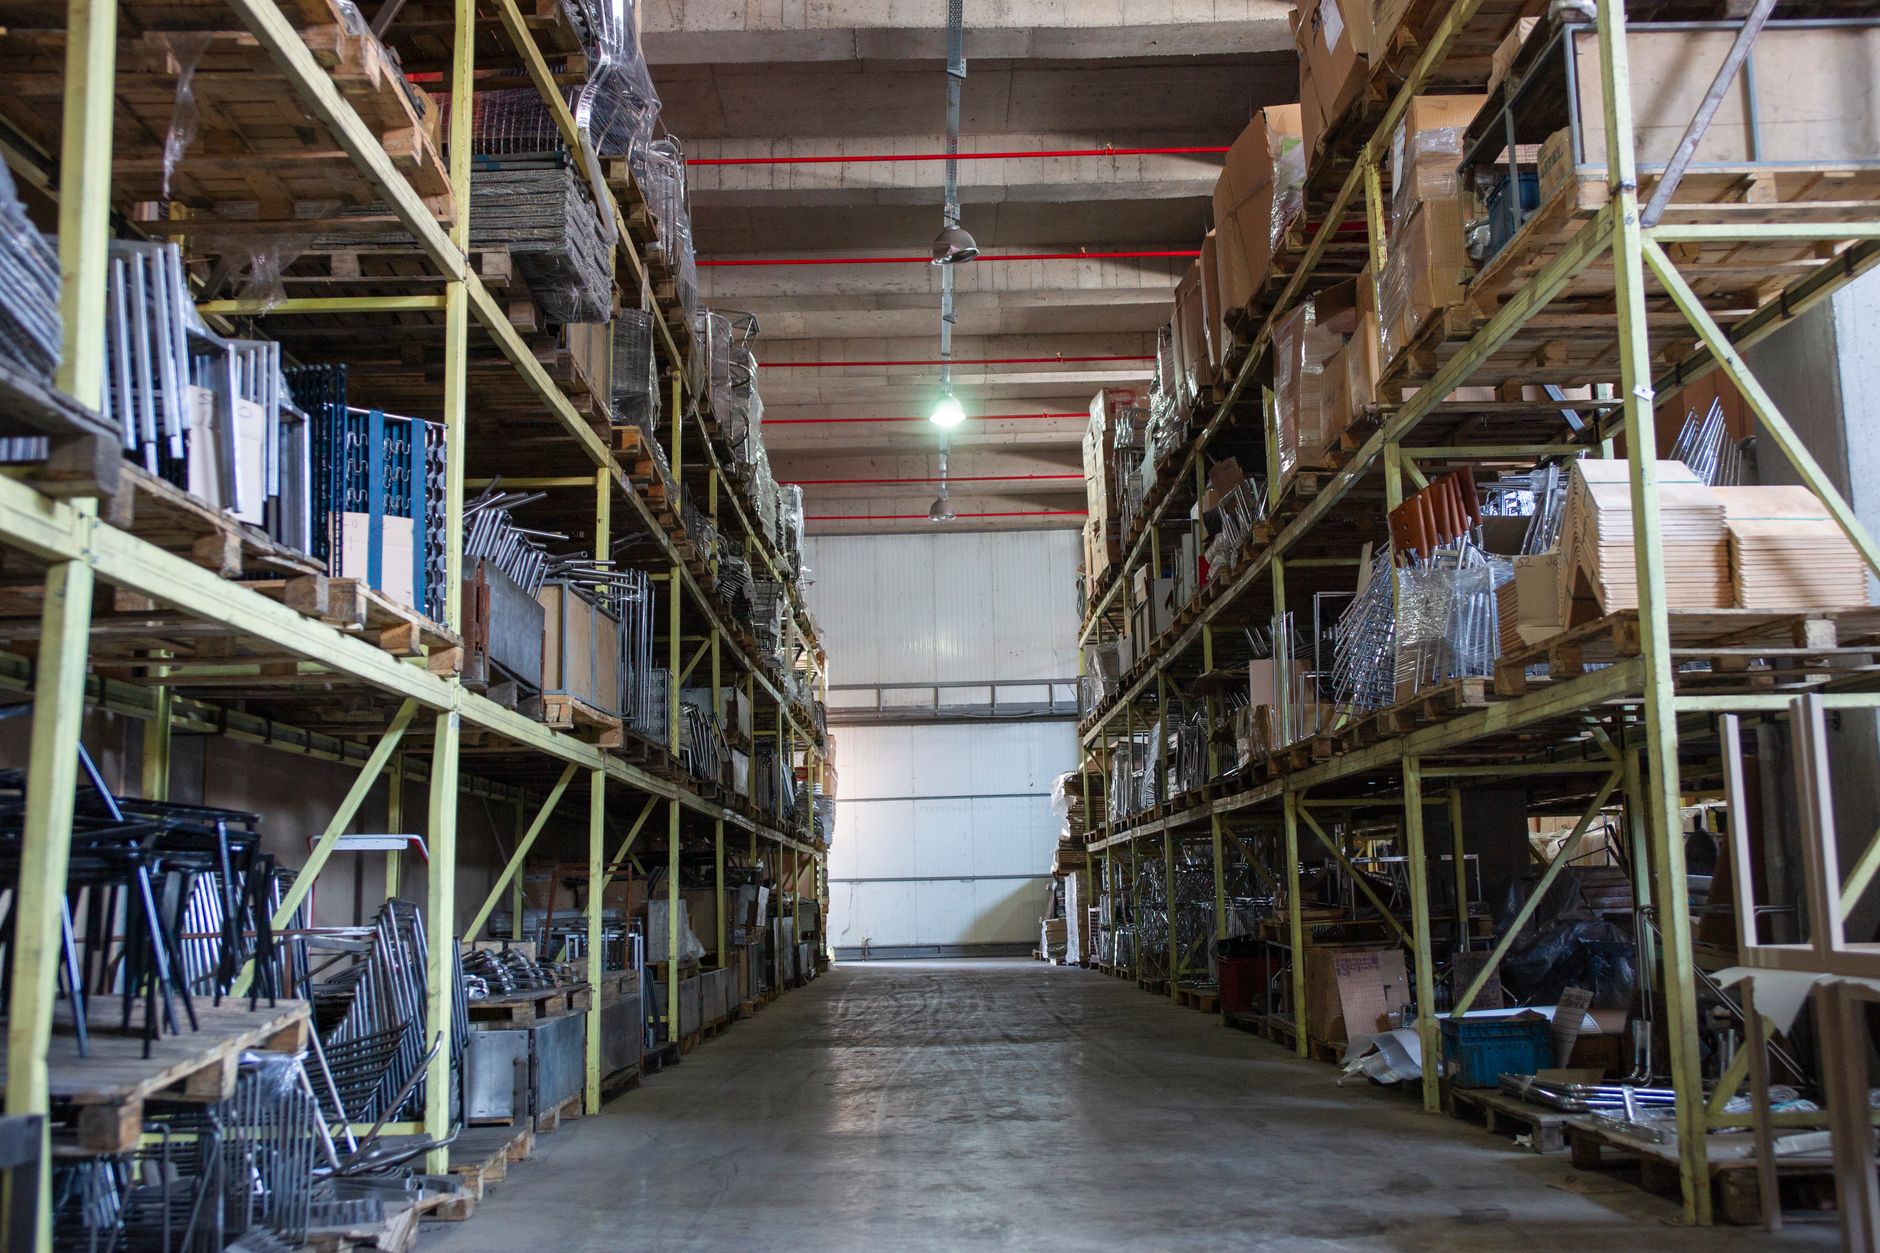
Most of the hours a robot takes sit in repeated moves: loads from the receiving dock to staging, stock from staging to racking, replenishment of pick faces, and outbound pallets to the doors. These moves follow the same routes many times per shift. Each trip also includes waiting, positioning and returning empty, which adds time a person spends between tasks.
Other work, such as inspecting damaged loads, resolving label mismatches and clearing jams, stays with people. The return depends on separating the first group of tasks from the second in your own building. The zones below show where the robot usually works and where staff keep control.
How does the ROI math work?
The math has four parts. First, the hours of this type of work per week that sit in repetitive lanes on your floor. Second, the share of those hours a robot can realistically take, which depends on route layout, load types and how often exceptions interrupt the lane. Third, the local wage for the job, which the government wage data on this page supplies and which values the labor offset. Fourth, the cost side: the fixed lease payment quoted after a site assessment, plus the supervision and exception handling that staff still provide.
The labor offset equals the hours taken over multiplied by the local wage. The net return equals that offset minus the lease payment and the staff time that remains. Because the share of hours is the least certain input, the calculator returns a savings range rather than one number, and the range narrows as the assessment measures your lanes. Staffing per site was not verified in our research, so the calculator starts from the headcount you report.
Lease cost is fixed, so the return rises when the robot runs more of the shift and falls when it sits idle. Idle time is the hidden variable. A robot that waits on a blocked aisle or a late dock door takes no hours, even though it is still on the lease. Check that the lane plan keeps the robot moving.
Autonomous forklift vs a person on the same pallet work
The robot wins on repetition. It takes the same route each run, does not tire at the end of a shift, and can run on scheduled hours that staff may not want to work. Its consistency makes route timing predictable, which helps dock planning. It does not improvise. Mercer's 2025 US Turnover Survey, as reported by WorkTime, put average voluntary turnover at 13.0 percent in 2025 and 26.7 percent in retail and wholesale, with transportation and warehousing not broken out, so staffing exposure in this sector needs its own check.
A person wins on judgment. Someone has to decide whether a damaged pallet moves, whether a mixed load is correct and how to reroute when an aisle is blocked. Those decisions are where many robot deployments stall, so the plan should assign them to staff from the start.
The table below compares the two honestly, including where each side is stronger. Use it to decide which tasks belong on the robot and which stay with people.
- Repetitive lane runs
Autonomous Forklift
Same route and speed on every run, with no fatigue on mapped lanes
Staff
Slower on long repetitive runs and needs breaks
- Off-hours coverage
Autonomous Forklift
Runs scheduled shifts once mapped and checked
Staff
Needs scheduling, off-hours pay and breaks
- Blocked aisles and reroutes
Autonomous Forklift
Stops or waits when the route is blocked
Staff
Reroutes and adapts without a prepared plan
- Damaged or mixed loads
Autonomous Forklift
Not suited to deciding what moves
Staff
Inspects, decides and documents
- Hiring and turnover exposure
Autonomous Forklift
Does not resign, but still needs trained supervisors
Staff
Turnover is common in this kind of work and adds training time
- Exposure in manual lanes
Autonomous Forklift
Takes repetitive lane exposure off staff
Staff
Exposed to forklift and manual handling hazards
What do injury and incident figures mean for the return?
According to National Safety Council Injury Facts, citing BLS data, forklifts were involved in 84 work-related worker deaths in 2024, up from 67 in 2023. The same NSC summary reports 25,110 forklift DART cases for 2023 to 2024, including 15,460 DAFW cases. DART counts cases with days away, restricted work or job transfer, and DAFW counts cases with days away from work. These figures do not translate directly into savings, but they show why fewer people in repetitive lanes has value beyond labor hours.
A vendor summary citing BLS reports 4.8 recordable cases per 100 full-time workers in warehousing and storage in 2024, against 2.6 across all industries. A different vendor summary gives 4.4 per 100 for transportation and warehousing in 2024, so the sector figures conflict. Check the primary BLS tables before using either figure in an internal approval memo.
BLS changed how it classifies injury events starting with 2023 data, so year-to-year forklift comparisons may not be direct. Treat any trend as a signal to verify, not a settled fact.
How do you get a precise figure and move toward payback?
Payback starts with a free site assessment. Service Robot Co. maps the floor, measures the repetitive lanes, records shift hours and sets the share of work a robot can take. The lease payment is quoted after that assessment, so the figure reflects your site rather than a generic template. We pick the right robot for the site, arrange lease financing, deploy and integrate the unit, train staff and service it nationwide.
The timeline runs in stages: the assessment and floor mapping, then the quote, then deployment and integration, staff training and go-live support. Payback comes only after the ramp period, when the robot runs its share of hours consistently. A phased start with one leased unit lets you measure real hours before committing to more units.
Ask for the savings range and the assumptions behind each input. A range built on measured hours is more useful than a single figure built on estimates.
What changes the number up or down?
The biggest upward drivers are long repetitive routes, a high volume of identical moves, late or overnight shifts where staffing is thin, and congested docks where people wait. Each of these gives the robot more hours it can take without adding supervision.
The biggest downward drivers are frequent exceptions, a floor that changes often and makes mapped routes stale, a single short shift, and loads that need a person to decide before anything moves. These cut the share of hours a robot can realistically take, which lowers the net return even when labor cost is high.
Labor cost sets the value of each hour. The government wage data on this page gives the local wage for this job, so the same hour of work carries more weight where the wage is higher. The number of hours is the part you control with layout and scheduling.
What risks threaten the return, and how do you avoid them?
The most common risk is overestimating the share of hours. A plan that assumes the robot takes every repetitive move usually misses the exceptions. Avoid it by measuring exceptions during the assessment and setting the range from those measurements.
Unmapped or changing floors are the second risk. A route that works today may fail after a rack moves, so keep layouts documented and ask for route reviews whenever the floor changes. Downtime is the third. A single unit that stops takes its lanes down with it, so plan for backup coverage through a spare unit and an on-site dispatch path. Remote triage can resolve some faults before anyone walks to the floor.
Service Robot Co. services units nationwide, so a Minneapolis site gets the same support model as any other site we run. Ask how service response is handled before you sign, confirm what the service plan covers, and keep the lease term and any insurance requirements in writing so you can compare them with the savings range.
Frequently asked questions
Upcoming events in Minneapolis, MN
Put a robot to work in Minneapolis.
We walk your site, learn the job, and recommend the unit that fits. Then we quote the lease, deploy it, and keep it serviced.
Sources
- US Bureau of Labor Statistics, Occupational Employment and Wage Statistics (OEWS May 2024)
- U.S. Bureau of Labor Statistics, OEWS May 2023 area table
- U.S. Bureau of Labor Statistics, OEWS May 2022 area table
- Voxel AI, warehouse safety statistics (citing BLS)
- National Safety Council, Injury Facts: forklifts
- Commercial data site citing Census County Business Patterns, warehousing and storage
- Modern Materials Handling, 2025 Industry Outlook survey (Peerless Research Group)
- WorkTime, employee turnover rate statistics (citing Mercer 2025 survey)
- Food Logistics, Vecna Robotics and CITE Research study