
The short answer
Autonomous mobile robot ROI in Nashville comes from hours of repeatable transport and floor care that laborers and freight, stock, and material movers, hand type of work takes today, valued at the local wage for that job. The size of the return depends on the share of that work a robot realistically handles, the fixed robot lease payment over the term, and how often the site struggles to staff those hours. A free site assessment turns the calculator estimate into a precise savings range for your floor.
See what a autonomous mobile robot costsRun the numbers in the ROI calculator
Key takeaways
- The return comes from repeatable hours of laborer and material mover work, valued at the local wage for that job.
- Only the share of work a robot realistically handles counts, so measure a baseline before you model it.
- Net the fixed lease payment and supervision time against the hours taken over, not against the gross labor bill.
- Night coverage and hard-to-fill shifts make the case strongest, because the robot covers hours the site would otherwise leave open.
- The calculator gives a range, and a free site assessment narrows it into a precise lease quote for your floor.
Run the numbers for your site
Auto-detected from your location - we use the real BLS wage here. Not right? Pick your city or state above.
What do you want to automate?
The robot takes the repetitive cart and pallet moves off the heaviest motion.
What is autonomous mobile robot ROI in Nashville?
Autonomous mobile robot ROI in Nashville is the net return a business gets from a robot that moves material or cleans floors without a constant operator, measured against what the lease costs over its term. The return comes from work people already do. When a robot takes over repeatable transport or floor care that laborers and freight, stock, and material movers, hand would otherwise perform, those hours have value at the local wage for that job. Everything else in the calculation depends on how much of the work the robot realistically takes and what it costs to keep running.
This page explains the math in plain terms so the person signing off can test each assumption rather than trust a headline. The calculator on the page is pre-filled for Nashville and produces a savings range, not a promise. Treat that range as a starting estimate that a site assessment will narrow.
How many laborers and material movers work in the Nashville area?
According to the BLS Nashville OEWS release for May 2024, about 37,980 people were employed in the Laborers and Freight, Stock, and Material Movers, Hand occupation in the Nashville metro area, with a location quotient of 1.79. A location quotient above 1 means the metro has more of this work than the national share would predict, so the local pool of people doing it is deep. The government wage data on this page gives the local pay for that job, which is the rate used to value the hours a robot takes over.
Read year-over-year movement with care. BLS adopted new metro definitions starting with the May 2024 release, so comparisons across releases are not like-for-like. Use the May 2024 figure for planning, and confirm it against the BLS table before citing it internally.

Median hourly wage, Laborers and Freight, Stock, and Material Movers, Hand
$4,427
Monthly cost of one full-time worker in Nashville, TN, at the median wage plus payroll costs (an estimate, not a quote).
Where does the return come from in a Nashville facility?
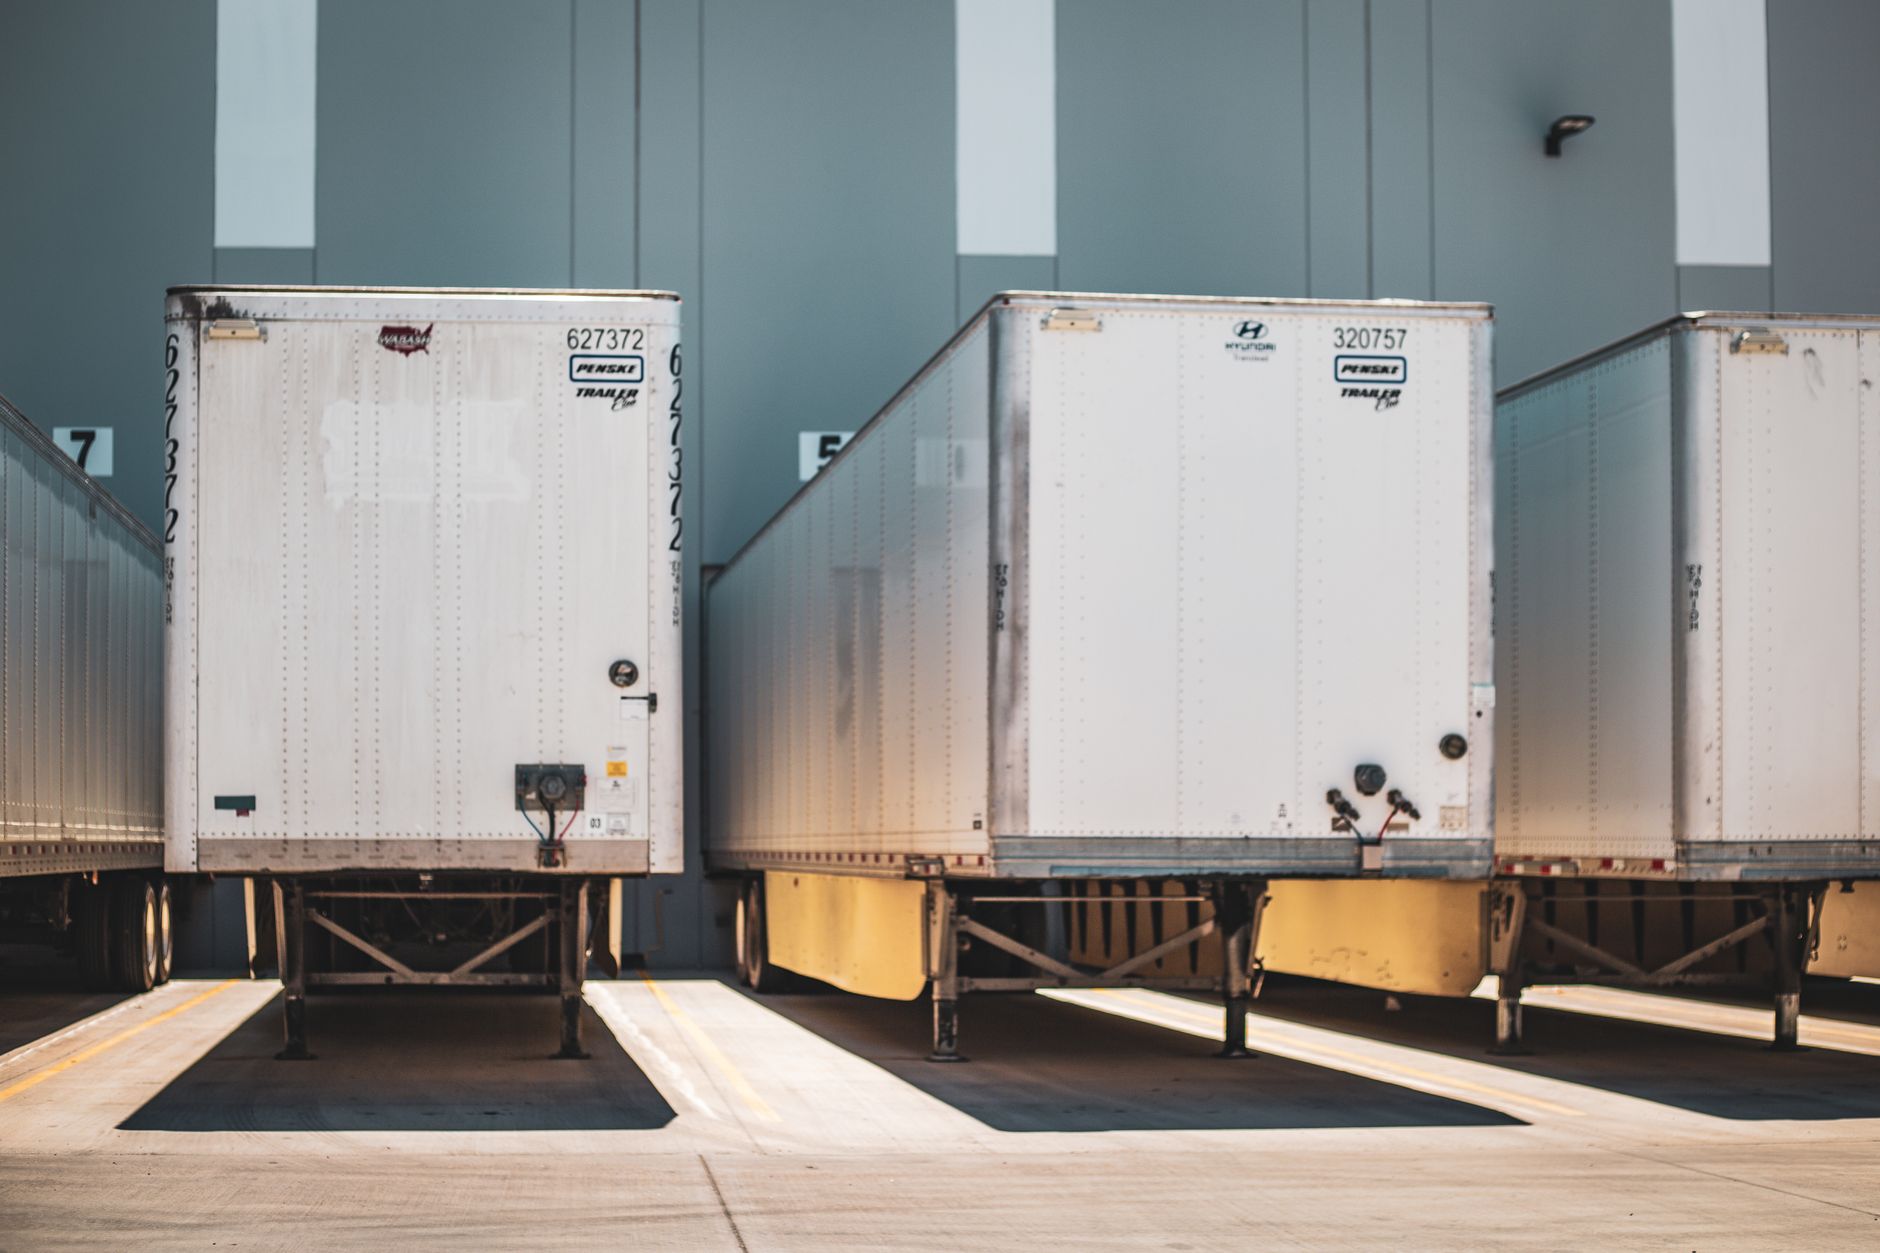
Most of the return comes from three kinds of repeatable work: moving pallets, totes, and carts along fixed routes, scrubbing or sweeping the same aisles on a schedule, and running restocking loops between receiving, storage, and staging. These tasks suit a robot because the path, the load, and the timing are predictable. Work that changes every shift, such as building a custom order or handling a damaged pallet, stays with people, and the calculation should say so.
Safety belongs in the same calculation. According to the BLS industry profile for warehousing and storage, total recordable cases ran 4.8 per 100 full-time workers in 2024. Fewer people pushing carts through shared aisles can reduce exposure, but only if the layout keeps people and vehicles apart and staff are trained on how the robot moves and stops.
How does the ROI math work?
Start with logged hours, not estimates. For each repeatable task, record how many hours a week people spend on it, broken down by shift, because night and weekend hours are where coverage gaps tend to show up. Multiply the hours a robot can realistically take over by the local wage for the job. If the site leaves some of those hours undone, record them separately, since they are the coverage gap a robot fills. The calculator uses a planning headcount of four people for this kind of site. That is an assumption, not a published count, so replace it with your own roster.
Subtract what the robot does not remove. Staff still load, unload, clear faults, and supervise, so those hours stay on the schedule. Subtract the fixed robot lease payment over the term, which is quoted after a free site assessment, along with any added supervision or charging time. What remains is the net return. The calculator shows it as a range because the realistic share of work is uncertain until the site is measured.

What raises or lowers the return?
The largest driver is the share of work the robot can take. A route that runs the same way every time can be handed off almost entirely, while a route with frequent blockages, changing racking, or mixed foot traffic may only offload part of the work. The second driver is coverage. A robot that runs overnight or on weekends fills hours that would otherwise need scheduled staff or go undone.
Turnover and open shifts push the number up. When shifts are hard to fill, the robot covers work a short-staffed site would otherwise leave open. Stable staffing with spare capacity pushes it down, since the robot then only replaces hours people already work. The checklist below lists what to verify before you trust the range.
What are the risks to the return, and how do you avoid them?
The most common risk is overestimating the share of work the robot takes. Avoid it by measuring the baseline first and planning for exceptions, which always need a person. The second risk is downtime. A unit out of service during a peak period can erase the labor offset for that window, so a plan for spare coverage or emergency replacement belongs in the decision from the start.
The third risk is layout. Changing racking, pallets left in aisles, and tight corners increase supervision time and slow routes. Map the site before committing to routes, and agree in writing on who clears faults and who owns the daily check. The myths below come up often in these discussions.
How does a robot compare with staff on the night shift?
A night shift is where the comparison is clearest, because a robot on a mapped route does not need scheduled breaks, but it still needs supervision. The table below sets the two side by side, including the areas where people are the better choice.
Neither option wins on every point. People handle variation and judgment well. A robot handles repetition and consistency well. The strongest case usually pairs a small number of robots on repeatable routes with the staff who already run the rest of the shift, so people spend their time on exceptions.
- Unattended operation
Autonomous Mobile Robot
Runs mapped routes without scheduled breaks once started
Staff
Needs scheduled shifts, breaks, and handover
- Blocked aisles
Autonomous Mobile Robot
Stops or reroutes, which slows the route until cleared
Staff
Moves the obstacle or finds another path on the spot
- Judgment and exceptions
Autonomous Mobile Robot
Needs a person to clear faults and handle unusual loads
Staff
Handles damaged goods, odd loads, and unexpected requests well
- Consistency of pace and path
Autonomous Mobile Robot
Repeats the same route the same way each run
Staff
Varies with fatigue, shift length, and workload
- Flexibility across tasks
Autonomous Mobile Robot
Best on repeatable routes with predictable loads
Staff
Wins on varied work and changing priorities
- Cost structure
Autonomous Mobile Robot
Fixed lease payment plus supervision and charging time
Staff
Pay, benefits, recruiting, and turnover that scale with hours
What do national labor and adoption figures say?
The labor market for this work is large and turns over. According to the BLS Occupational Outlook Handbook, about 7.0 million hand laborers and material movers held jobs in 2024, with about 1,008,300 openings projected each year for the broader group. For the narrower laborers and freight, stock, and material movers occupation, onetonline.org reports about 2,988,900 people employed in 2024 and about 384,300 projected annual openings, figures derived from BLS data. Openings describe how often employers must recruit replacements, which is the recurring cost a robot can reduce.
Adoption is still partial. In a survey of companies reported by automatedwarehouseonline.com, Interact Analysis found that 71 percent had only partially automated workflows with mobile robots, and respondents averaged 3.4 robot suppliers. A separate survey by Peerless Research Group in January 2025 drew on 217 professionals, but that sample was not random, so treat it as directional rather than representative.
What is a realistic timeline from assessment to payback?
The timeline runs in stages, and the longest stages are measurement and site preparation, not the robot itself. Start with a site assessment and a baseline log of the work in question. Then map the routes, agree on layout changes, and deploy in phases, starting with one route or one unit before wider coverage. A phased start lets the site confirm the hours before committing to the full fleet.
Payback depends on how quickly the robot reaches its planned share of the work. Early weeks usually show a lower offset while staff learn the routes and the exceptions. Judge the return on steady-state operation, not the first days. Check actual hours against the baseline at fixed points after go-live, and adjust the calculator inputs when measured numbers differ.
How do I get a precise figure from a free site assessment?
A free site assessment turns the calculator range into a number you can approve. We map the space, measure the routes and hours with your team, identify which tasks a robot can take, and define the staff roles that remain. We then quote the fixed robot lease payment for the term, with service and support included, so every option is compared on the same basis.
Bring your own records to speed it up: the job titles on the floor, shift times, existing hours logs, and any history of open shifts. The more measured inputs we have, the narrower the savings range becomes. The result is a quote for your site, not a national average, and the calculator on this page shows the range you can test against it.
Frequently asked questions
Put a robot to work in Nashville.
We walk your site, learn the job, and recommend the unit that fits. Then we quote the lease, deploy it, and keep it serviced.
Sources
- US Bureau of Labor Statistics, Occupational Employment and Wage Statistics (OEWS May 2024)
- BLS Nashville OEWS release, May 2024 data
- BLS Occupational Outlook Handbook, Hand Laborers and Material Movers
- BLS Industry Profile, Warehousing and Storage (NAICS 493)
- Interact Analysis mobile robot buyer survey, via Automated Warehouse Online
- Peerless Research Group warehouse robotics survey, via Material Handling 24/7
- O*NET Online local trends for occupation 53-7062