
The short answer
The autonomous mobile robot ROI in Oklahoma City comes from repetitive freight and material moving hours that a leased robot takes over from staff on the same shift, weighed against a fixed robot lease payment quoted after a free site assessment. Expect a savings range rather than one number, because the share of the work a robot realistically takes depends on routes, shift hours and floor fit. Payback follows from that range, the lease cost and the labor hours you actually recover once the robot runs its planned share of the shift.
See what a autonomous mobile robot costsRun the numbers in the ROI calculator
Key takeaways
- Return comes from repetitive transport hours the robot takes over, not from wage levels alone.
- The savings range is priced on the local wage for laborers and freight, stock and material movers, hand.
- Route fit and shift coverage move the number more than any other input.
- Payback starts only after go-live, once the robot runs its share of the shift consistently.
- Start with one leased unit on the most repetitive route before adding a fleet.
Run the numbers for your site
Auto-detected from your location - we use the real BLS wage here. Not right? Pick your city or state above.
What do you want to automate?
The robot takes the repetitive cart and pallet moves off the heaviest motion.
What is the autonomous mobile robot ROI in Oklahoma City?
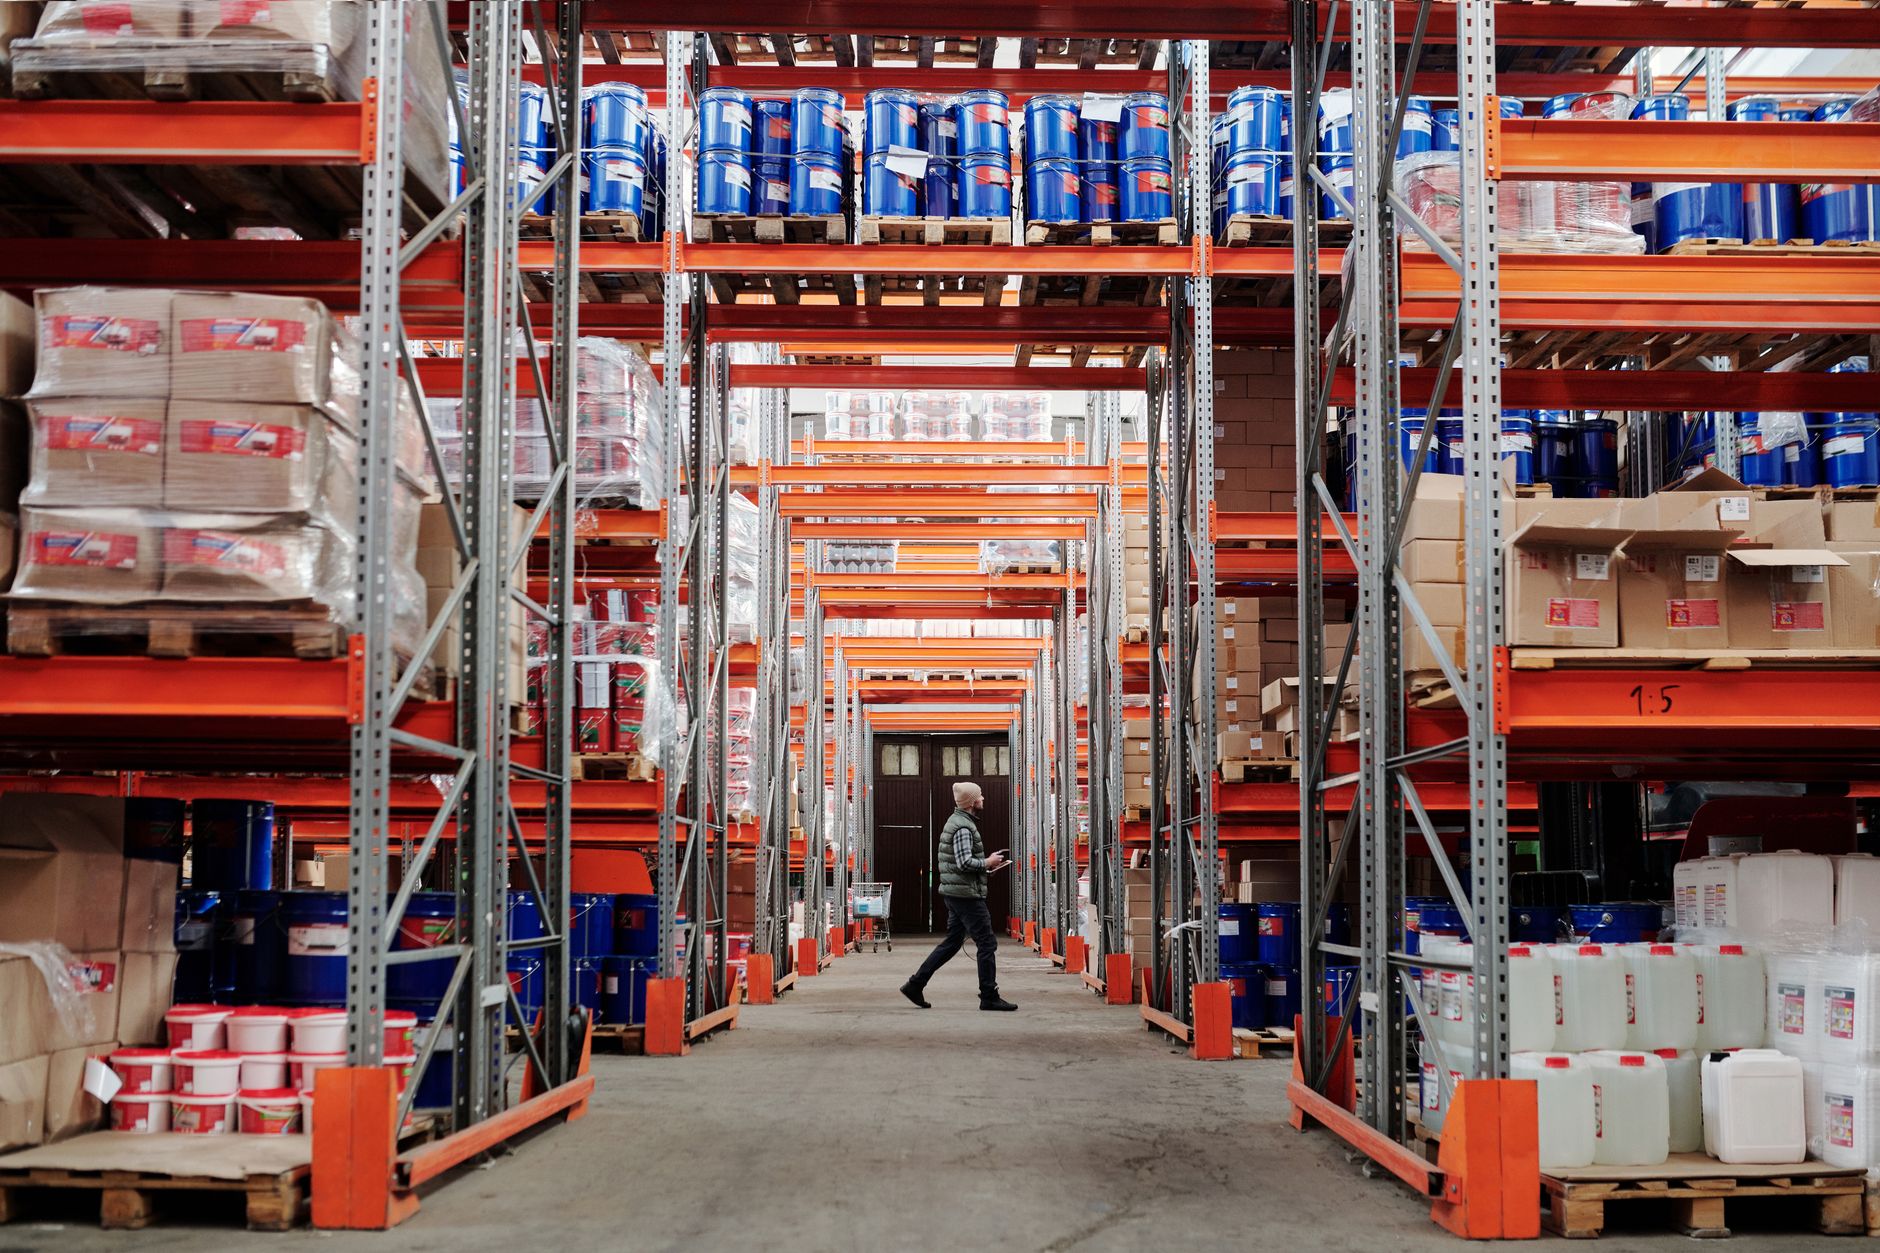
Return on an autonomous mobile robot is simple to state and harder to measure. You count the hours of work the robot takes over, price those hours at the local wage for the job, subtract the cost of the lease and the upkeep, and compare the result with what the site pays today to cover the same hours. In Oklahoma City that work is mostly freight, stock and material moving: carrying pallets, totes and cases between receiving, storage, staging and the dock.
We are a US commercial robot integrator. We pick the robot that fits the site, lease it through financing, deploy and integrate it, train the staff who work beside it, and service it nationwide. Because we handle the integration as well as the lease, the estimate on this page is tied to a floor plan and a set of routes, not to a generic model. The calculator on this page is set for Oklahoma City and shows a savings range. We narrow that range during a free site assessment, and the lease quote follows from it.
Why does Oklahoma City suit this kind of return?
Oklahoma City is one of the larger US metros for which we hold government wage data, so this page uses local numbers instead of a national average. The BLS May 2024 release for the metro reports a mean wage for all occupations below the national mean for all occupations. That matters for the math. A lower hourly wage shrinks the value of each hour a robot recovers, so the return here has to come from steady volume, long shifts and routes that a robot can run without a break. The government wage data panel on this page gives the local wage for the specific job the savings range is priced on.
Warehousing has grown in the region. According to the Kansas City Fed, warehousing employment in both the Oklahoma City and Tulsa metros at the end of 2022 was about 3.5 times its 2015 level. The wider transportation, warehousing and utilities sector in the Oklahoma City metro, according to FRED, recorded 31.5 thousand jobs as a 2024 annual average, down from 31.9 thousand in 2023 and 33.2 thousand in 2022. The broader sector has fallen since 2022, after warehousing had grown through that year, so staffing plans should allow for both growth and a flatter stretch.
The May 2024 release defines the Oklahoma City metro by seven counties, listed below, using the 2020 census definitions. Those are the counties whose workforce the employment and wage figures on this page describe. Floor transport work can reach across them, so route planning should account for where stock moves between sites.
- Canadian County
- Cleveland County
- Grady County
- Lincoln County
- Logan County
- McClain County
- Oklahoma County
Median hourly wage, Laborers and Freight, Stock, and Material Movers, Hand
$4,079
Monthly cost of one full-time worker in Oklahoma City, OK, at the median wage plus payroll costs (an estimate, not a quote).
How many labor hours does a robot actually take over?
No government source publishes the hours one site spends on floor transport, so the hours that count come from your own time logs and our site assessment. For national context, ONET, which uses BLS data, lists 2,988,900 jobs in the laborers and freight, stock and material movers, hand occupation in 2024, projected to reach 3,033,100 by 2034. The BLS Occupational Outlook Handbook projects 4 percent growth for the broader hand laborers group over the same decade and calls that about as fast as average. No published count gives people per site, so for this page we assume a planning crew of four at one mid-size site, to be replaced by your roster.
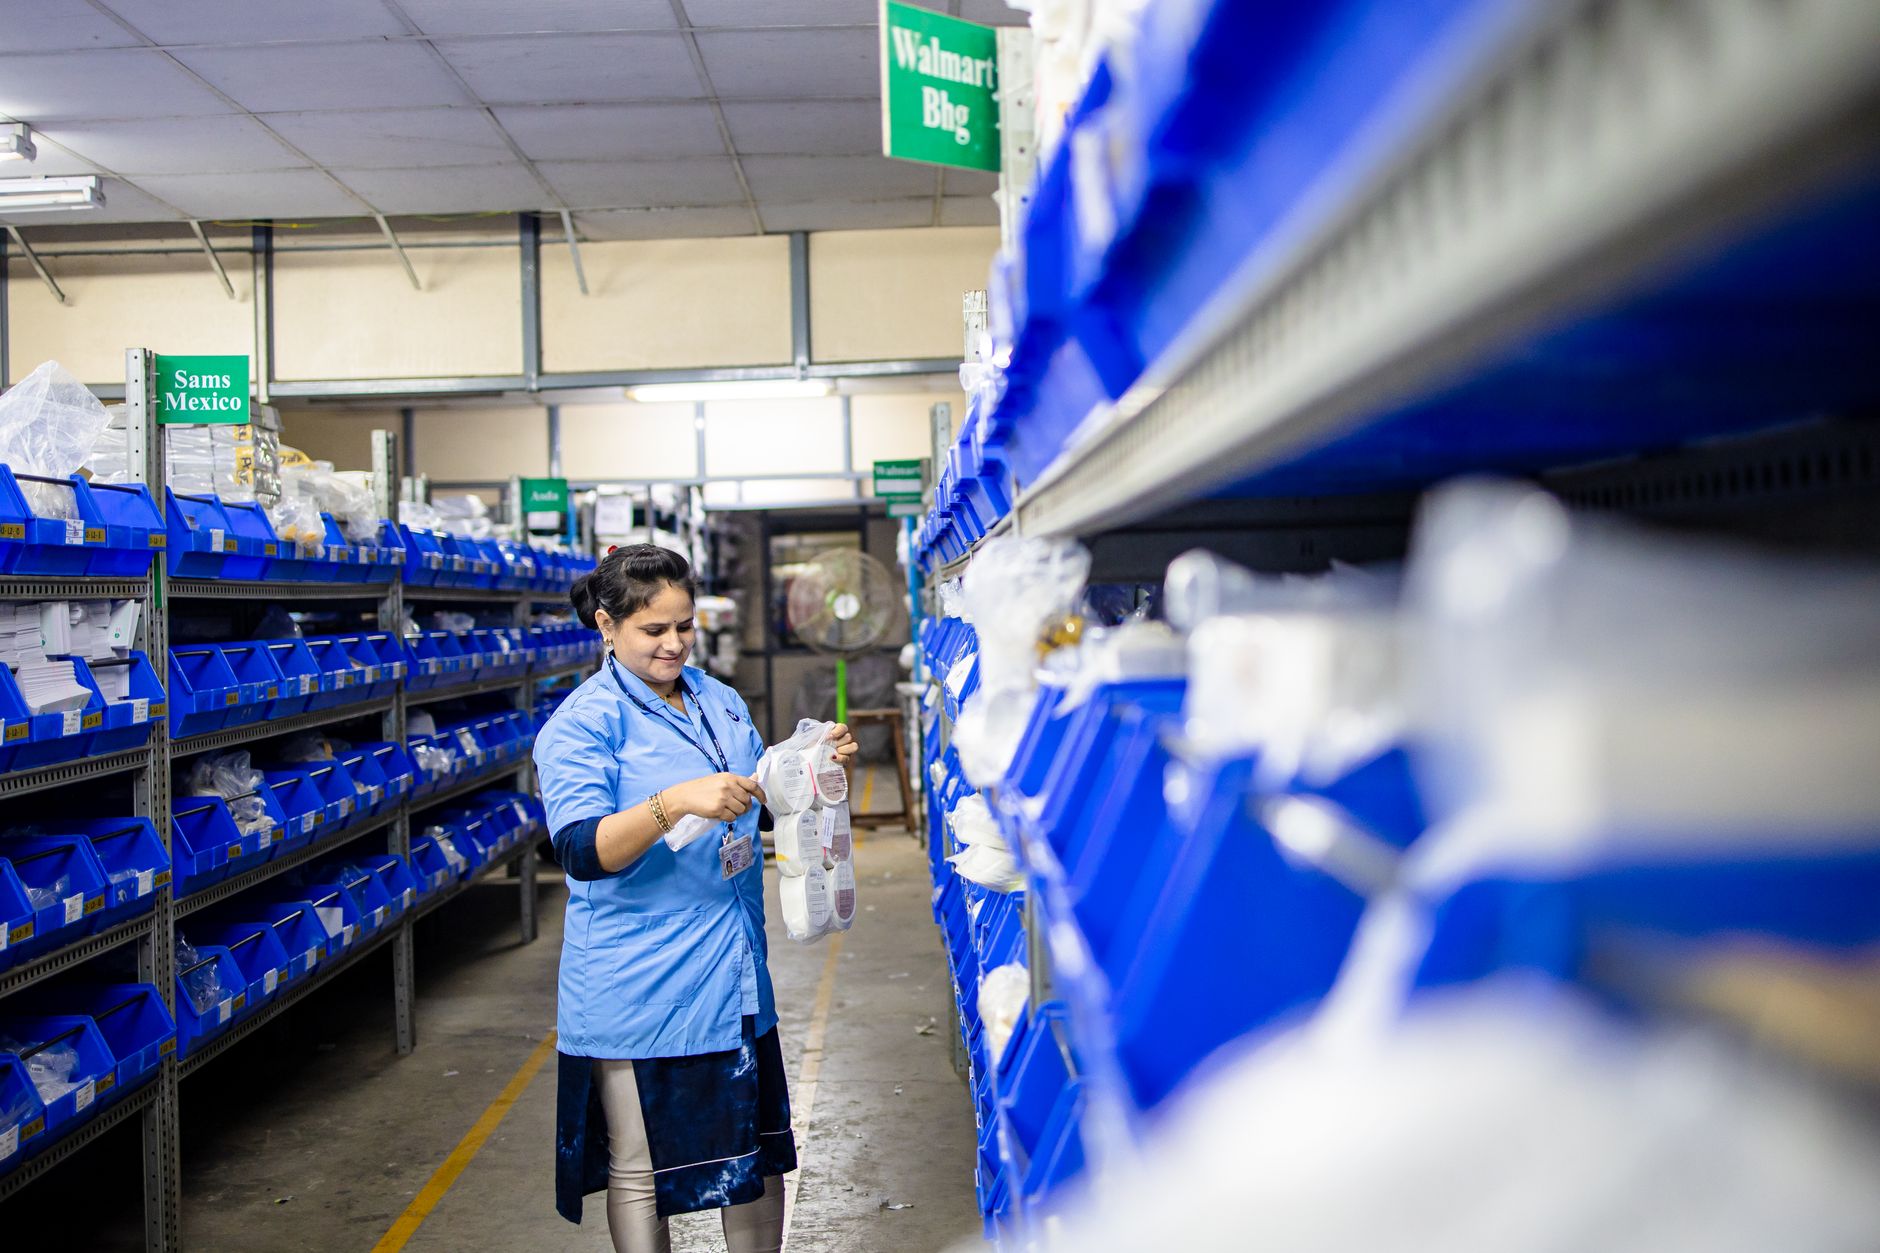
The useful question is not how many people hold the occupation but how many hours each shift spends on repeat movement a robot can handle. Those hours sit on predictable routes: the dock to staging run, the replenishment trip to the pick area, and the return of empty carts and totes. A robot takes the repeat legs. People keep exception handling, damage checks, loading decisions and anything that needs judgment. The table shows the split we use in an assessment. It is written in words because the hour counts belong to your site, not to a published average.
How is the savings range worked out?
The math has four parts. The first is the labor hours offset: the hours per week the robot takes from work that is staffed today, multiplied by the local wage for laborers and freight, stock and material movers, hand, and by the number of weeks the robot runs. The second is the share of the work a robot realistically takes. A route can be fully automated, partly automated, or left to people, and only the automated share counts toward the return. The third is the lease cost, which is a fixed robot lease payment quoted after the site assessment. The fourth is the running cost of any robot, including charging, route upkeep and the service plan.
The savings range is the gap between the labor the robot offsets and the lease and upkeep, shown as a low case and a high case. We show a range because the share of work and the hours recovered are estimates until a robot runs your floors. A lease can still be a good return at the low end if the robot covers night or weekend work that would otherwise go unstaffed, because those hours carry no offset from existing staff. A low automated share pulls the return down, which is why the assessment tests each route before we quote.
Check the arithmetic against your own records. Take the hours your transport crew logged last month, identify the share of those hours on routes a robot can run, and multiply through. If the result sits far from the calculator, the difference usually lives in the automated share, not in the wage.
What changes the number up or down?
Three factors move the return most: how much of the shift is repetitive transport, how many hours the robot can run, and how well the floor and routes fit a robot. Fewer hours or a cramped layout push the number down. Long routes, multiple shifts and heavy repeat moves push it up. The local wage matters, but it is one input among several, and a site with a modest wage can still show a strong return when volume is high and the routes are long.
Turnover affects the story but is not the main driver. JOLTS reports an annual average quits rate of 2.0 percent across all industries for 2025, according to the BLS. Quits in transportation, warehousing and utilities fell by 49,000 in July 2025 in the BLS monthly release, which shows the labor pool moves from month to month. Planning should not assume a fixed crew. A robot gives steady coverage on its routes whatever the month's turnover looks like, and that steadiness is part of its value.
Other factors include the service response time, the lease term, and whether the site allows unattended operation at night. Each one can change the share of work a robot takes or the hours it can cover.
How does a robot compare with a person on this work?
A robot is not a substitute for everything a person does on a floor, and the comparison is only useful if it is honest. The robot wins on consistency, repeat runs and staying on a route for a full shift. A person wins on judgment, handling damaged or unusual loads, and reacting when a route is blocked in a way the robot did not expect. The practical result is a mixed team. The robot takes the steady legs, and staff keep the work that needs a decision.
Training covers how staff hand off loads to the robot, how to clear a blocked route, and when to call service. That handover is where much of the return is won or lost in the first weeks after go-live, so we spend time on it rather than treating it as a formality. Adoption is growing, but the broad figures are for factory robots. According to The Robot Report, summarizing the IFR World Robotics report, the operational stock of industrial robots rose 9 percent to a record 5 million units in 2025, and annual sales fell 8 percent to fewer than 25,000 units. Those are not warehouse AMR counts, so they say little about one site.
- Repeat moves on a fixed route
Autonomous Mobile Robot
Runs the same route on schedule without breaks
Staff
Covers the route well but tires and needs breaks
- Night and weekend coverage
Autonomous Mobile Robot
Can run unattended when the site allows it
Staff
Needs staffing and a shift premium for those hours
- Judgment on damaged or unusual loads
Autonomous Mobile Robot
Flags the exception but does not decide it
Staff
Decides, reroutes and documents the problem
- Blocked aisles or a changed layout
Autonomous Mobile Robot
Stops or reroutes only within the mapped area
Staff
Works around the obstacle and reports it
- Setup before go-live
Autonomous Mobile Robot
Needs mapping, integration and staff training first
Staff
Needs site and task onboarding first
- Main cost driver
Autonomous Mobile Robot
Fixed lease payment and service plan
Staff
Wages, benefits and the cost of unfilled shifts
What are the risks to the return, and how do you avoid them?
The biggest risk is an overstated share of work. A robot planned for a route it cannot run in practice recovers little labor and still carries the full lease cost. Avoid it by testing each route during the assessment and starting with a limited set of runs before adding more. The second risk is downtime. If a robot stops and no backup is ready, the staff covering that route are back on the work, and the offset disappears for those hours. Ask for a service plan with on-site dispatch and remote triage, and confirm the backup approach before signing.
Safety belongs in the plan too. A robotics vendor's safety summary reports that warehousing and storage recorded a total recordable rate of 4.8 per 100 full-time workers in 2024, with a DART rate of 4.1. Those figures are vendor-reported and were not checked against a BLS release for this page. Taking repeat legs off staff may reduce some exposure, but a robot in a busy aisle adds its own hazards. Separate pedestrians and forklifts from robot paths, mark the routes clearly, and train staff on the stop and reroute procedure before go-live.
Watch for scope creep. A robot that starts on one route often gets asked to cover more, and each added route brings new exceptions. Add routes in steps, and review the hours each new route really recovers before extending the lease scope.
How long does it take to reach payback?
The timeline runs in stages, and the payback clock starts only when a robot runs real work. First is the free site assessment, where we map routes, measure the transport hours and test the share a robot can take. Next is the quote, which includes the fixed lease payment through financing. Then comes deployment and integration, staff training and go-live support. Payback starts after go-live, once the robot runs its planned share of the shift consistently rather than in a few good days.
A common approach is a phased start. A pilot with one leased unit on the most repetitive route tests the assumptions before a fleet is added. If the pilot confirms the hours, the next routes follow. Judge the pilot by how many runs finish on schedule across a full set of shifts, including the handoffs, the blocked routes and the service calls. Those results tell you more than the best week.
Timing also depends on the site itself: floor preparation, door access, and how quickly staff adopt the handoff routine. Build those into the plan, and your payback estimate will be easier to test against the first month's numbers.
How do I get a precise figure for my site?
A precise figure comes from a free site assessment. Send us your shift schedule, the transport routes you run, the hours staff spend on them, and your layout. We map the floor, identify which legs a robot can take, and build the savings range from your numbers instead of averages. You receive the calculator output for your site, the lease quote and the service terms together.
Treat the range as a working estimate that tightens with each data point you add. The assessment costs you only the time it takes to pull your logs. For an Oklahoma City site, the local wage for this job appears in the government wage data on this page, and we use that figure directly rather than a national average. The more exact the inputs, the narrower the range.
Frequently asked questions
Put a robot to work in Oklahoma City.
We walk your site, learn the job, and recommend the unit that fits. Then we quote the lease, deploy it, and keep it serviced.
Sources
- US Bureau of Labor Statistics, Occupational Employment and Wage Statistics (OEWS May 2024)
- BLS Oklahoma City metro occupational employment and wages, May 2024
- FRED, transportation, warehousing and utilities jobs, Oklahoma City MSA
- Kansas City Fed, Oklahoma Economist: warehousing boom
- O*NET OnLine, 53-7062.00 local trends
- BLS Occupational Outlook Handbook, hand laborers and material movers
- BLS Job Openings and Labor Turnover Survey
- Warehouse safety statistics, vendor industry page
- The Robot Report, IFR World Robotics reporting