
The short answer
An autonomous mobile robot in a Minneapolis warehouse pays back by taking over hours of pallet and tote moving that people would otherwise do, minus the fixed lease payment and service costs. The return is a range, not a fixed figure, because it depends on how much of this work the robot realistically takes, how long the shifts run, and how the floor is laid out. The autonomous mobile robot ROI in Minneapolis becomes a precise number only after a free site assessment measures the actual routes.
See what a autonomous mobile robot costsRun the numbers in the ROI calculator
Key takeaways
- The return comes from transport hours the robot takes over, net of the lease and the supervision that remains.
- Model hours at the local wage for this job from the government data on this page, not from a guess.
- Only part of the work is realistically robotic, so measure routes before relying on any share.
- Savings are ranges that move with shift length, route length, floor condition and layout.
- Get the exact lease payment and return range from a free site assessment.
Run the numbers for your site
Auto-detected from your location - we use the real BLS wage here. Not right? Pick your city or state above.
What do you want to automate?
The robot takes the repetitive cart and pallet moves off the heaviest motion.
Autonomous mobile robot ROI in Minneapolis: what the return really is
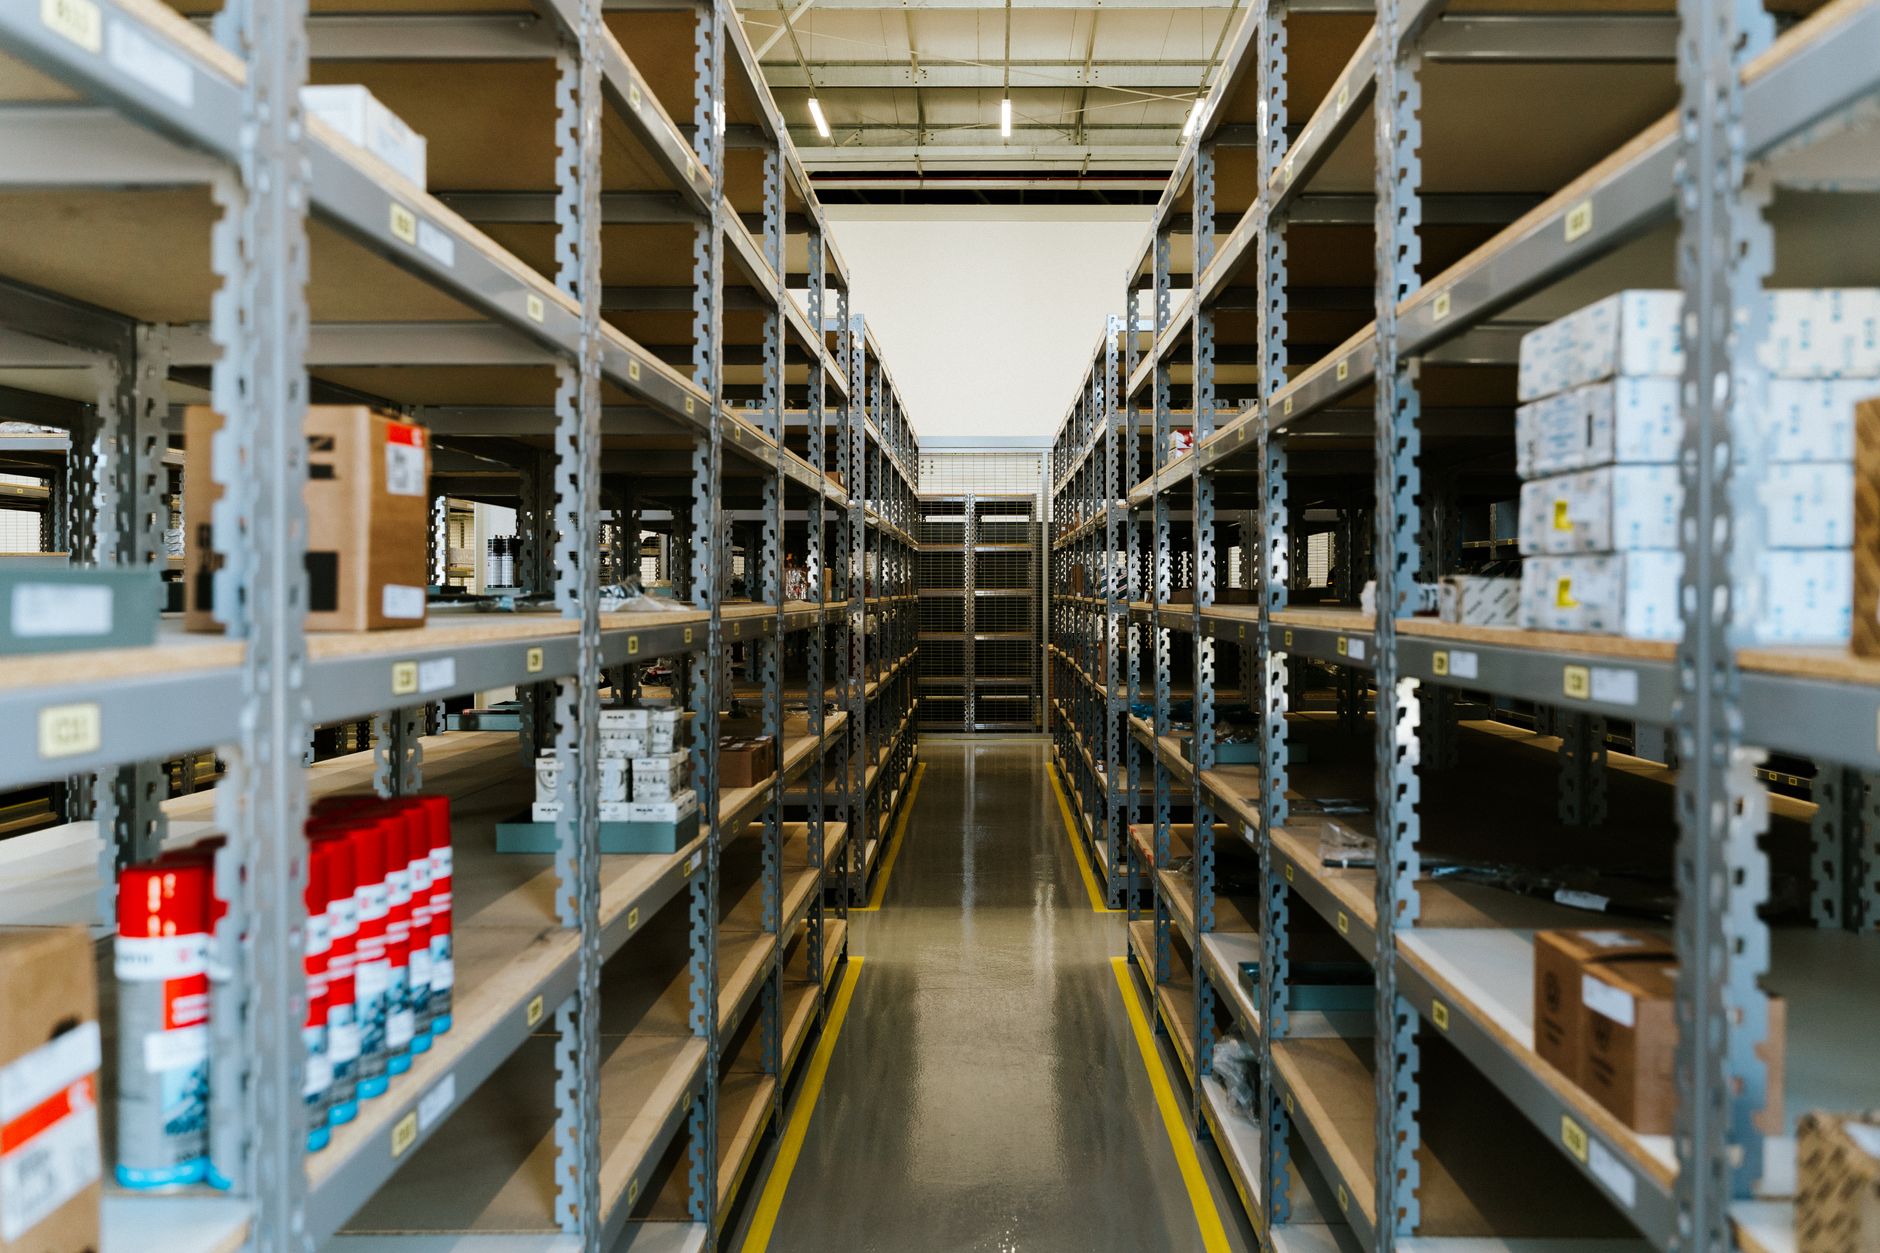
Autonomous mobile robot ROI in Minneapolis comes from one source: labor hours spent moving material that a robot can move instead. In a warehouse or distribution site, that means pallets, totes and carts traveling between receiving, storage, staging and pick areas. The robot does not replace the whole job. It takes a defined share of the transport work, and the people still on the floor handle loading, exceptions, quality checks and anything the robot cannot do.
The return is therefore a range. It is the value of the hours taken over, minus the fixed lease payment and service costs, judged across the lease term. Two sites of the same size can land far apart: one runs long routes down a single aisle, while the other runs short routes across open floor. That is why the calculator on this page shows a range, and why a precise figure needs measured routes.
The labor side of the math is local. The government wage data on this page covers Laborers and Freight, Stock, and Material Movers, Hand, the job this robot mainly takes over, and the savings figures are priced on that wage. Read the range against your own shift schedule before you read it against anything else.
How many people do this kind of work in Minneapolis and across the US?
According to the Bureau of Labor Statistics Occupational Employment and Wage Statistics, about 36,880 people held jobs in Laborers and Freight, Stock, and Material Movers, Hand in the Minneapolis-St. Paul-Bloomington, MN-WI metropolitan area in May 2023. That is the most recent metro count we could verify for this page, so it is older than the May 2024 wage data shown beside the text. The same series reported about 35,780 jobs in that metro in May 2022.
Nationally, the BLS Occupational Outlook Handbook reports about 7.0 million hand laborers and material movers in 2024. About 2,988,900 of those people were in the detailed occupation Laborers and Freight, Stock, and Material Movers, Hand. The handbook projects about 904,200 openings per year for hand laborers and material movers over the decade, which measures how much hiring this work will require rather than how many people will leave any one site.
Metro and national counts tell you how deep the labor pool is. They do not tell you how many people a given site puts on this work. Staffing depends on shift pattern and on how much material the site moves by hand, so the figure that matters for your return is the one you record during the site assessment.
Median hourly wage, Laborers and Freight, Stock, and Material Movers, Hand
$5,209
Monthly cost of one full-time worker in Minneapolis, MN, at the median wage plus payroll costs (an estimate, not a quote).
Where does the labor return come from in a warehouse?
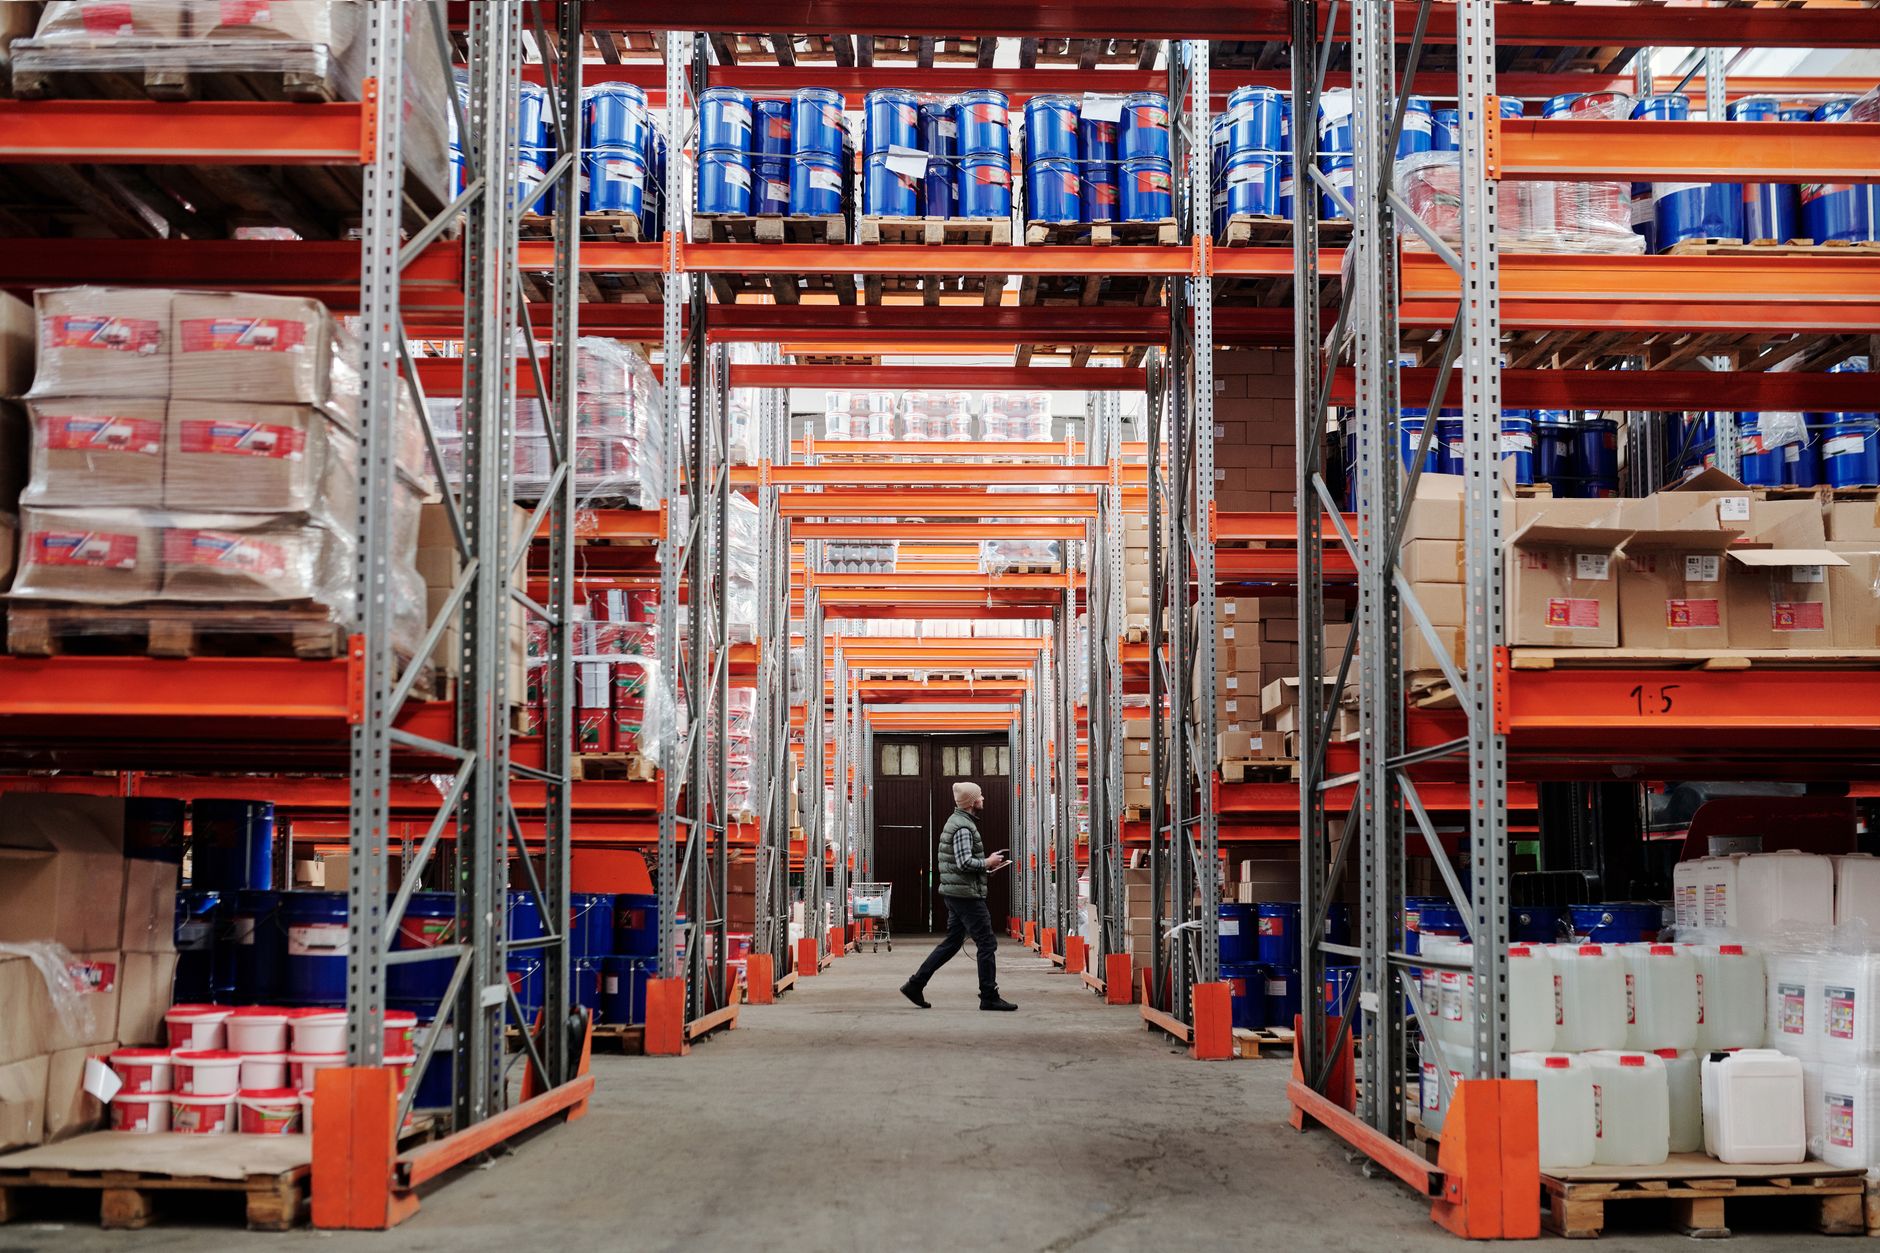
Most of the return in this setting comes from transport work that repeats every shift. A cart run from receiving to a staging lane, a tote run from a pick face to a packing station, and a restock run from storage to a line are short, predictable and frequent. A robot does this kind of work well when the route is fixed and the load is standard, and it avoids the walking and waiting that fill a person's shift between real tasks.
Coverage is the second source. A robot can run during off hours when the site may carry a thinner crew, so work that would wait for the day shift moves earlier. Unfilled shifts often push transport work into the next shift, which adds cost that a simple count of hours misses. The offset is strongest where routine trips make up most of the transport load.
Safety belongs in the case too, but argue it carefully. According to the BLS industry page for warehousing and storage, that industry employed about 1,842,000 people in its latest seasonally adjusted series, and it recorded 32 fatalities in 2024, up from 28 in 2023. Fewer manual cart pushes help, but a robot brings its own traffic and needs its own safety rules, and both must be designed into the layout.
How is autonomous mobile robot payback calculated?
For a Minneapolis site the math is simple in form. Start with the hours per shift that transport work takes today. Multiply the share of those hours a robot can realistically take over by the number of shifts it covers. Price those hours at the local wage for this job from the government data on this page, then subtract the fixed lease payment, service costs and the supervision that stays with staff. What remains, across the lease term, is the return.
The share is the input most people get wrong. Not every trip is robot work. Odd loads, tight doorways, pallets that are too heavy or irregular, and tasks that need a person's judgment stay with staff. A realistic share comes from walking and logging the real routes, not from the robot's top speed. The calculator starts from a range for that share, and the site assessment replaces the range with your measured figure.
The lease side is fixed, and it is quoted after the site assessment. Compare it against the hours you take over, net of any staffing that remains for exceptions, rather than against a single hour of wage. Each input is a range, so the result is a range too. The table below shows the kinds of transport work that usually sit inside the share.
What raises or lowers the autonomous mobile robot return?
Several inputs move the result more than anything else. Shift length and the number of shifts per day set how many hours a robot can cover. Route length and repetition decide whether a robot trip beats a person's trip. Floor condition, doorway widths and dock layout decide how much of the route is usable. Each one can push the return toward the top or the bottom of the range.
Staffing choices matter as much as the robot. A site that cuts supervision too far may find exception work landing on the same people, which erodes the net offset. A site that keeps trained staff on manual moves for backup can hand more of the routine work to the robot with less risk.
Work through the checklist below before you rely on any figure, including the one the calculator shows. Include the people who run the floor, not only management, because they know which trips are routine and which only look routine on paper.
What are the risks to the return and how do you avoid them?
The most common risk is overstating the share. A site that assumes the robot takes every routine trip usually misses its number early, because exception work lands on the same people. Set the share from the route log, and treat the top of the range as a target to earn, not a forecast.
The second risk is downtime. A robot that stops in a busy aisle can block a route and pull people back to hand work. Plan a fallback before go-live: keep staff trained on manual moves, agree on who clears a stopped unit, and confirm how quickly a repair or replacement can be dispatched. Service coverage belongs in the lease terms, not in an afterthought.
The third risk is adoption drag. Staff who see the robot as a threat will work around it. Name the tasks the robot takes and the tasks people keep, and give the people who run those tasks a role in the rollout. We train the staff on site as part of deployment and service the robot nationwide, so the uptime question is answered in writing before the lease starts.
How common are autonomous mobile robots in US warehouses?
Adoption is growing, but the surveys do not measure the same thing, so read each number with its label. A secondary summary of the MHI 2025 survey reports that robotics adoption rose to 48 percent in 2025, with nearly half of surveyed firms reporting active robot deployments. That figure counts any robot, not only AMRs, and we have not checked it against the MHI report itself.
A study cited by Vecna, a vendor, and dated unclear, reports that 70 percent of companies had never deployed an AMR and 76 percent had never deployed an AGV. In a market-research press release, ABI Research projects about 50,000 warehouses will use robots by 2025. That is a forecast, not a count of sites.
The sources do not show a single pace of adoption, so a site that has not yet automated is not automatically behind. Judge the decision by the transport work on your own floor, not by the average across the industry.
What is the timeline from site assessment to payback?
The timeline runs in a fixed order, and the early steps decide how precise the later ones can be. The free site assessment maps the floor, logs the routes and measures the share of work a robot can take. It ends with a lease quote, a deployment plan and a return range built from your numbers.
Once you accept the quote, the robot is mapped into the facility, integrated with doors and any systems it must interact with, and tested on a limited route. Staff are trained on site during go-live. A phased start on one predictable route is the lowest-risk path, because it measures the share before more units are added.
Payback arrives when the hours taken over, net of supervision and exception work, cover the lease and service costs. That point depends on the share you measured, so the timeline becomes precise only after a full run of logged shifts. Plan for a measurement period after go-live, and review the range against that data.
- Free site assessment, floor mapping and route log
- Lease quote, deployment plan and return range
- Robot mapped into the facility and integrated with doors and systems
- Limited pilot on one predictable route
- On-site staff training and go-live support
- Review of logged shifts against the return range
How do you get a precise figure from a free site assessment?
A precise figure comes from measured inputs, not from a web page. Bring your shift schedule, the number of people who move material each shift, dock and aisle layouts, and any floor plans you have. Note the loads you handle and any limits, such as floor loading, restricted areas or doorways that cannot be widened.
We run the assessment on site. We select the robot that fits the floor, not the other way around, and we measure the routes so the share reflects your work. The output is a lease quote, a deployment plan and a savings range built from your numbers. Use that range in your decision in place of the calculator estimate on this page.
Test the assumptions in this page during the assessment. If the logged share is lower than the calculator assumed, the return falls, and you want to know that before the lease starts. The assessment is free, so the only cost of checking is your time on the floor.
Frequently asked questions
Upcoming events in Minneapolis, MN
Put a robot to work in Minneapolis.
We walk your site, learn the job, and recommend the unit that fits. Then we quote the lease, deploy it, and keep it serviced.
Sources
- US Bureau of Labor Statistics, Occupational Employment and Wage Statistics (OEWS May 2024)
- BLS OEWS May 2023 metro table
- BLS Occupational Outlook Handbook, hand laborers and material movers
- BLS industry page, warehousing and storage
- Secondary summary of MHI 2025 survey (pulse.bot)
- Vecna-cited warehouse automation study (SDC Executive)
- ABI Research press release on warehouse robots