
The short answer
Drone ROI for industrial cooling tower operators comes mainly from visual inspection hours that no longer need a person to climb or rig access, and from looks taken while the tower keeps running. The return is a range, not a promise: it depends on how many visual rounds the site runs, how much of that work a drone can realistically take, and the lease quote that follows a free site assessment. Drones photograph fill edges, louvers and basin areas from height, but they do not replace the hands-on check that finds scale inside the fill.
Key takeaways
- Drones shorten the visual part of a cooling tower inspection, not the whole job.
- The labor side is priced in hours of security guard type work the drone takes over, at the local wage for this job.
- Scale inside the fill pack still needs an endoscopic camera or a hands-on check.
- Falls are the strongest safety reason to cut routine climbs, and OSHA records describe falls of 8 and 12 feet in this setting.
- The lease quote follows a free site assessment that measures your own inspection hours.
Run the numbers for your site
Pick your city or state for a real regional number - we use the real BLS wage there. (On the live site this auto-detects from your location.)
What do you want to automate?
The unit runs the repetitive patrol and watch; guards handle the judgment calls.
What is drone ROI for industrial cooling tower operators?
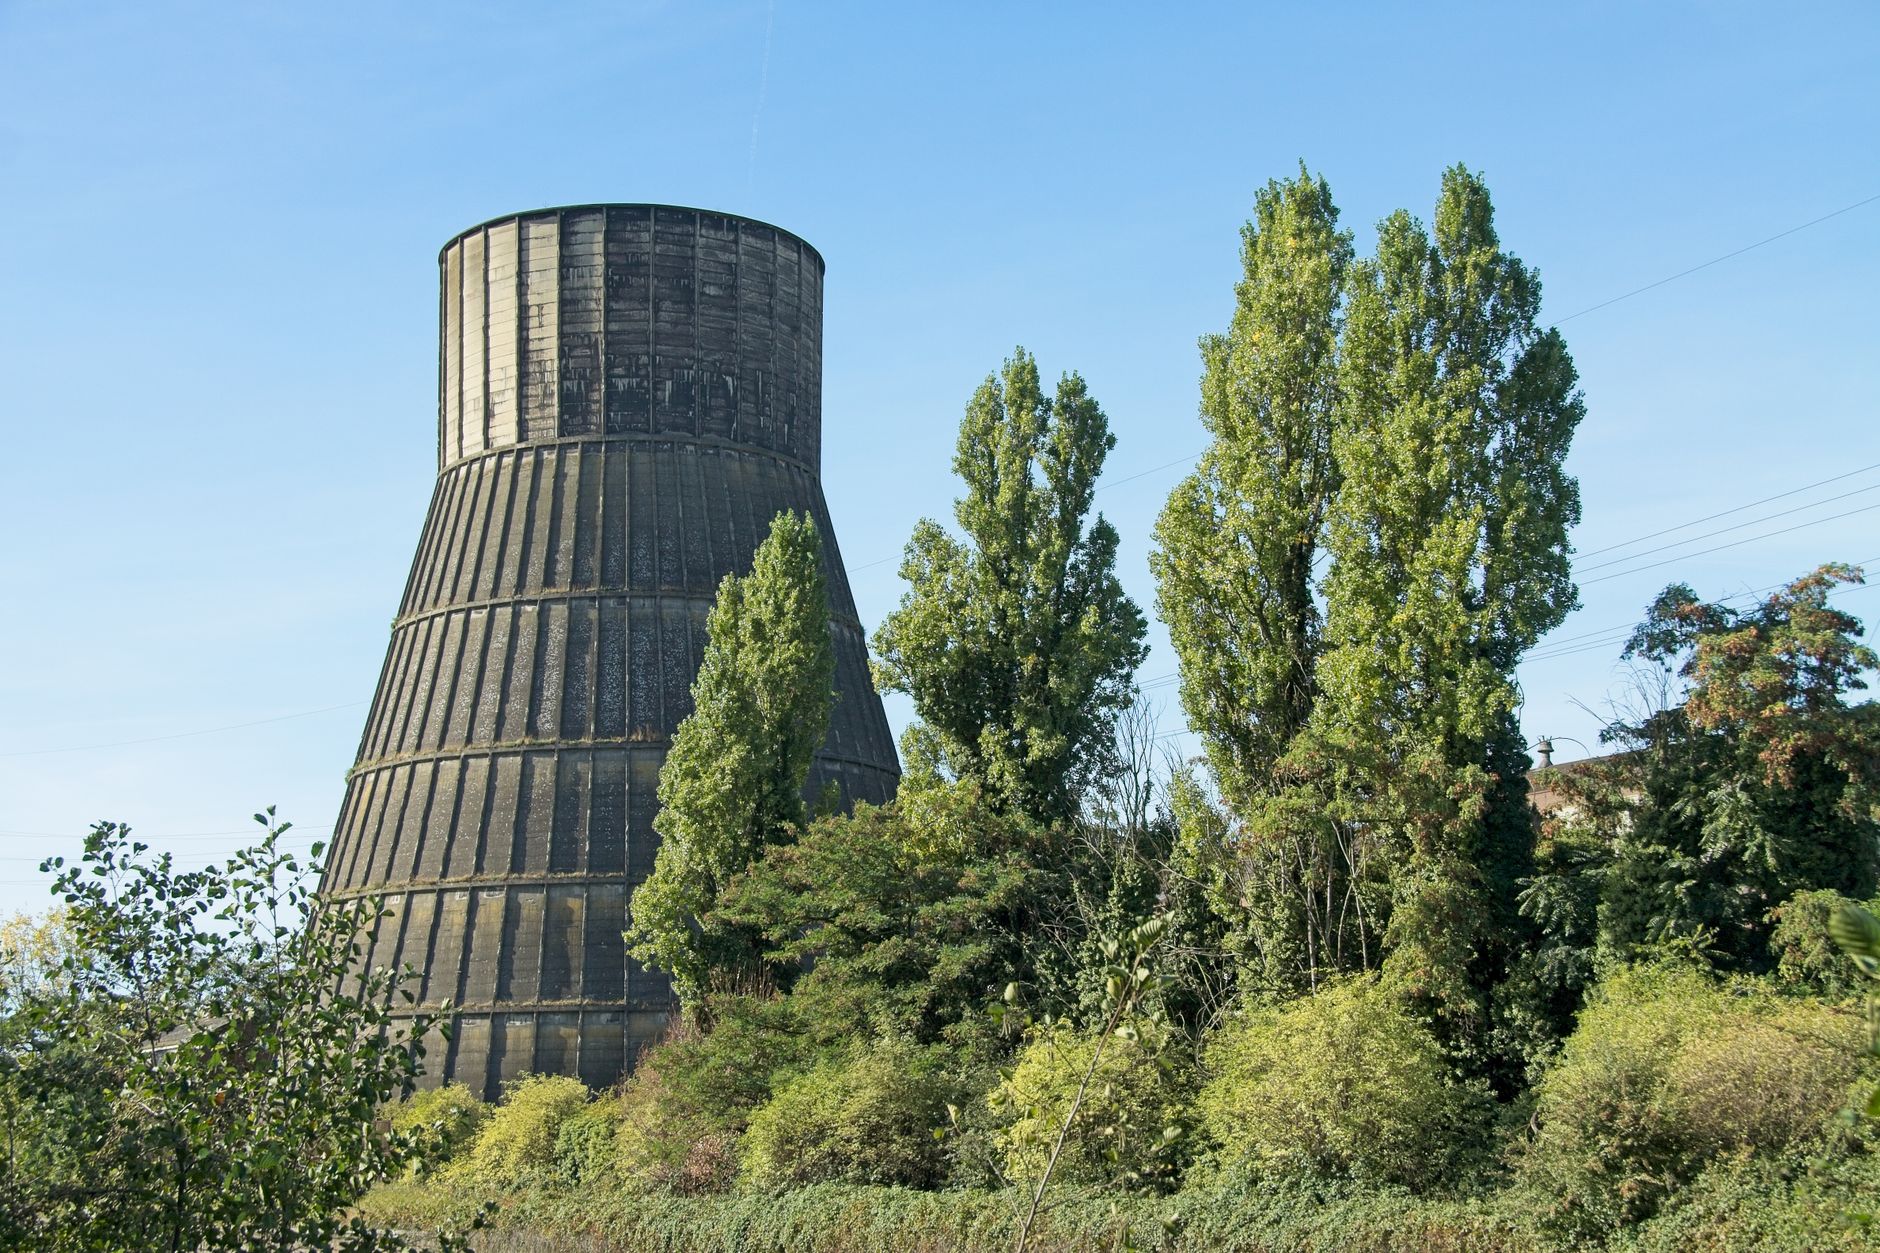
Drone ROI for industrial cooling tower operators is the return from using a leased drone to photograph a tower's fill packs, louvers and basin areas from height, so inspectors can spot damage without climbing the structure or stopping the unit. The return is measured in labor hours taken off the visual inspection and in climbs that never have to happen. It is not a claim about how fast the drone flies.
A cooling tower is a tall, wet, corroding structure. The parts that wear first, such as louvers, drift eliminators and fill, sit high on the tower or deep inside it. The U.S. Department of Energy's Better Buildings operations checklist for cooling towers lists checking drift eliminators, louvers and fill as a monthly task, looking for scale buildup and proper positioning. Meeting that cadence by climbing every time is slow and carries real fall exposure.
Service Robot Co. is a US commercial robot integrator. We pick the right drone or robot for the site, lease it through financing, deploy and integrate it, train staff, and service it nationwide. For cooling towers, the work starts with a site assessment rather than a model choice.
Where does the return come from at a cooling tower?
The return comes from three places: fewer hours spent on the visual part of inspection, fewer people put on a ladder or a roof for routine looks, and fewer interruptions to the tower's duty. A drone flies the outside and top of the structure, takes a sequence of photos, and gives the inspector images of fill edges, louver slats, drift eliminator faces and basin surfaces. Those images are often enough to decide whether a crew needs to climb and what they need to bring.
The labor side is priced in hours of security guard type work the drone takes over, such as walking a set route and observing and reporting what is seen. The page prices those hours at the local wage for this job, using the government wage data panel next to this text. The Bureau of Labor Statistics projects 1 percent employment growth for security guards from 2025 to 2035, which it describes as slower than average, so filling those hours by hiring may not get easier. A secondary aggregator citing May 2024 national survey data reports about 1.24 million security guards employed in the country, a figure to check against the official table. Technician time for climbing and repair is not priced, because the drone does not take over that work.
The second source of return is avoided interruption. A look that needs no climb can often be done while the tower runs, which keeps cooling duty available. A fuller check still belongs in a planned outage. The drone reduces how often an outage is needed just to look, but it does not remove the outage when the inside needs work.
Median hourly wage, Security Guards
$4,317
Monthly cost of one full-time worker, at the median wage plus payroll costs (an estimate, not a quote).
- Visual check of louvers and top deck
Drone
Photographed from height without a climb, repeatable on the same route
Staff
Climbs or rigs access to see the parts close up
- Scale inside the fill pack
Drone
Limited to surface and edge images, so deep scale is often missed
Staff
Can use an endoscopic camera or a hands-on check inside the fill
- Basin and sump areas
Drone
Good overview from above and along the edge
Staff
Walks the rim and notices sludge, odor and debris directly
- Speed of a routine look
Drone
Set up once, then the same flight repeats with little crew time
Staff
Crew assembles access, climbs, inspects and descends each time
- Judging the severity of damage
Drone
Flags areas for review but does not decide what the damage means
Staff
An experienced inspector judges structural and fill damage on site
- Weather and wind
Drone
Flights stop in strong wind or rain
Staff
Crews also pause in bad weather, though they can still work some days a drone cannot
How much of the inspection can a drone realistically take?
The honest answer is the outer and visual part of the job. Vendor claims say drones can cover fill packs, louvers and basins, with software that grades defects. Those claims are vendor-reported and were not independently verified in this review, so treat them as a starting point for a pilot rather than a benchmark.
According to an ACR Journal article, cooling towers should be inspected annually as warm weather arrives, with louvers checked and fill media inspected for scale, algae and contaminants. A drone can build the photo record of louvers and the fill edges, and it can support a mid-season look. It cannot see scale deep in a counterflow pack. The same article notes that counterflow fill can be checked with an endoscopic camera inserted into the fill, which still needs a person on site.
A realistic share is the visual rounds between the annual hands-on checks, plus the first look after a storm or a freeze. Set the share with the site assessment, not from a brochure. The table below shows which tasks move to the drone and which stay with people.
| Task | Today | With a robot |
|---|---|---|
| Photo survey of louvers and top deck | A climb or rigged access for each look | Flight from the ground, then review at a desk |
| Basin and edge check | Walking the basin rim and sump | Flight over the basin with photos for review |
| Fill scale check | Opening access and checking fill by hand or camera | Still done by a person, planned from the drone images |
| Look after a storm or freeze | Ad hoc climb to see what broke | Same day flight to decide whether a climb is needed |
| Repairs and louver replacement | Technicians work on the structure | Unchanged, technicians still do the work |
The research pass found no published hour figures for these tasks. Your own log and the site assessment supply the hour numbers. This table shows which tasks move, not how many hours they take.
How does the ROI math work?
The math has three inputs: the hours of visual rounds the drone takes over, the share of those hours that is realistic to replace, and the lease cost. Start with the number of visual rounds per year, multiply by the hours each round takes, then multiply by the share the drone can do. That gives the hours offset. Value those hours at the local wage for this job, then subtract the lease cost and the added time for flight planning and image review.
The lease is a fixed payment set through financing, with service included. It is quoted after a free site assessment, and it is the other side of the ROI. A site with many towers spreads setup across more rounds. A single small tower may not generate enough visual work to cover the lease, so the math can come out negative there. The calculator on this page runs the same logic and shows a range.
Read the range as a range. The low end assumes few rounds and a small share of replaced work. The high end assumes the drone takes the full visual round and the site runs many rounds a year. Neither end is a promise. The true position sits where your own hour log and the assessment place it.
What changes the number up or down?
Three things move the return most: how many towers the site runs, how often the visual check happens, and how much of that check the drone can cover from the ground. More towers and more rounds push the return up. Problems that sit inside the fill push it down, because a drone cannot see deep scale. Scale matters for planning too. According to EurekAlert, the U.S. has more than 2 million cooling towers, though the release does not state its method, so treat it as a rough sense of scale only. Statista, citing EIA data from 2015, reports that about 309 recirculating cooling systems were used for coal-fired plants, a partial figure.
Access and airspace also matter. Towers near other structures, tall stacks or restricted areas take longer to plan and can limit flights. Weather is a large factor. Wind and rain stop flights, so the number depends on how many days a year the site can actually fly.
Use the checklist below before you accept any range. Each item changes the number in a direction you can check.
What are the risks to the return and how do you avoid them?
The main risk is overstating the share of work the drone takes. If it only handles the outside, the hours offset is smaller than a full climb replacement story suggests. Avoid this by measuring the split in the site assessment and writing the scope down before the lease starts.
The second risk is a missed defect. Surface photos can miss scale and fill damage inside the pack. Keep the hands-on check on the annual schedule, and use drone images to plan that check, not to skip it. Train the reviewers to compare each set of photos against the last one, so change is visible over time.
The third risk is data without action. Photos that nobody reads return nothing. Name a reviewer, set a reporting path to the maintenance lead, and keep the same flight route each time so changes show up clearly.
Why does reducing climbs matter for safety?
Falls are the strongest reason to cut routine climbs. OSHA incident records describe workers killed after falls in cooling tower settings. One 1996 record describes a fall of about 8 feet from a small water cooling tower. Another describes a fall of 12 feet while a worker climbed a ladder to investigate a leak on a rooftop tower.
The CDC and NIOSH report Falls, a Deadly Hazard for Tower Workers covers the wider picture for tower work. The individual OSHA records do not add up to a national count, and the research pass found no aggregate figure for cooling tower fall fatalities. OSHA's Injury Tracking Application is the place to look for current totals.
A drone does not remove every climb. Repairs and close inspection still need people on the structure. The research pass found no published headcount for cooling tower inspection, so this page assumes two people for a climb, one to climb and one to watch the access. The site assessment confirms the real number for your towers.
What does a realistic timeline from assessment to payback look like?
The timeline runs in stages. First comes the free site assessment, which maps the towers, measures the hours spent on visual rounds today, and checks flight conditions. Second is a pilot on one tower or one site, where the scope and image review get tested. Third is the rollout to the rest of the towers and the handoff of routine rounds.
Payback follows the rollout, not the pilot. A pilot shows whether the photos are useful and whether the review path works. The rollout shows the hours offset across a full year of rounds, including the weather days that stop flights. Payback arrives when that offset covers the lease and the review time. Because the timing depends on your round count, the assessment gives a date range built on your own schedule rather than a generic guess.
Plan for the first season to act as the test. A full year of images from the same route is what shows real change in fill, louvers and basin condition.
How do you get a precise figure from a free site assessment?
Bring the tower list, the inspection schedule, the last two years of inspection and repair records, and any access notes. The site assessment checks each tower's layout, nearby structures, airspace and planned flight route, then records the hours spent on visual rounds today.
From that, the assessment sets the share of work the drone can take, the flight days per year, and the review workload. Those three inputs drive the savings range and the lease quote. The lease quote is given after the assessment, with service included, through financing. Ask for it in writing with the scope it assumes.
Ask the assessment to show its assumptions, so you can check each one against your own log before you decide. A precise figure comes from your hours, not from a typical site.
Frequently asked questions
Want a drone at your industrial cooling tower operator?
Tell us about your site. We will recommend the robot, quote the lease, and keep it serviced.
Sources
- US Bureau of Labor Statistics, Occupational Employment and Wage Statistics (OEWS May 2024)
- Better Buildings O&M checklist for cooling towers (U.S. Department of Energy program)
- ACR Journal, Is your cooling tower up to the task?
- Bureau of Labor Statistics, Occupational Outlook Handbook: Security Guards
- OSHA incident record, cooling tower fall
- CDC/NIOSH, Falls, a Deadly Hazard for Tower Workers
- EurekAlert news release on U.S. cooling towers
- Statista, number of cooling system types by energy source (citing EIA)
- Buildings Security, security guard employment statistics (secondary aggregator)