
The short answer
Cleaning robot ROI for university buildings comes from custodial hours that scheduled autonomous scrubbing and sweeping takes off the night and early shifts in corridors and lecture halls. The realistic savings range depends on how much of each floor's routine work a robot can take, what those hours are worth at the local wage for this job, and the fixed lease payment quoted after a site assessment. Payback holds up when the robot covers enough of the shift to remove overtime or unfilled positions, not just the hours on paper.
Key takeaways
- The return comes from custodial hours moved off the night and early shifts, not from removing the crew.
- Corridors and lecture halls suit scheduled robots because traffic is heavy and the layouts repeat.
- Restrooms, spills, trash and furniture stay with staff, so the share of floor work taken is the key input.
- Savings are ranges built from your hours and your floor, never a promise.
- A free site assessment turns the range into a lease quote and a payback estimate for your building.
Run the numbers for your site
Pick your city or state for a real regional number - we use the real BLS wage there. (On the live site this auto-detects from your location.)
What do you want to automate?
The robot runs the open floor overnight; your crew keeps detail and edges.
How much custodial work does a university building carry?
Cleaning robot ROI for university buildings starts with how much floor work sits inside the custodial role. According to the U.S. Bureau of Labor Statistics, janitors and building cleaners held about 2.4 million jobs in 2024. Educational services, including state, local and private employers, accounts for 17 percent of that employment, second only to services to buildings and dwellings at 35 percent. The Bureau projects 2 percent growth from 2024 to 2034, slower than average, with about 351,300 openings a year, so filling vacancies stays a routine task for facilities managers.
Campus scale is what makes the hours add up. According to the National Center for Education Statistics, 3,931 Title IV degree-granting institutions reported for 2020-21, down from 4,599 in 2010-11, and that count splits into 1,294 two-year colleges and 2,637 four-year colleges. An earlier De Anza College custodial review describes a campus of 968,836 square feet staffed by 22 custodians, which works out to about 44,038 square feet per custodian. The review's own arithmetic says that ratio could support APPA Level 4 cleaning only if all staff reported for work.
Where does the return come from in a university building?
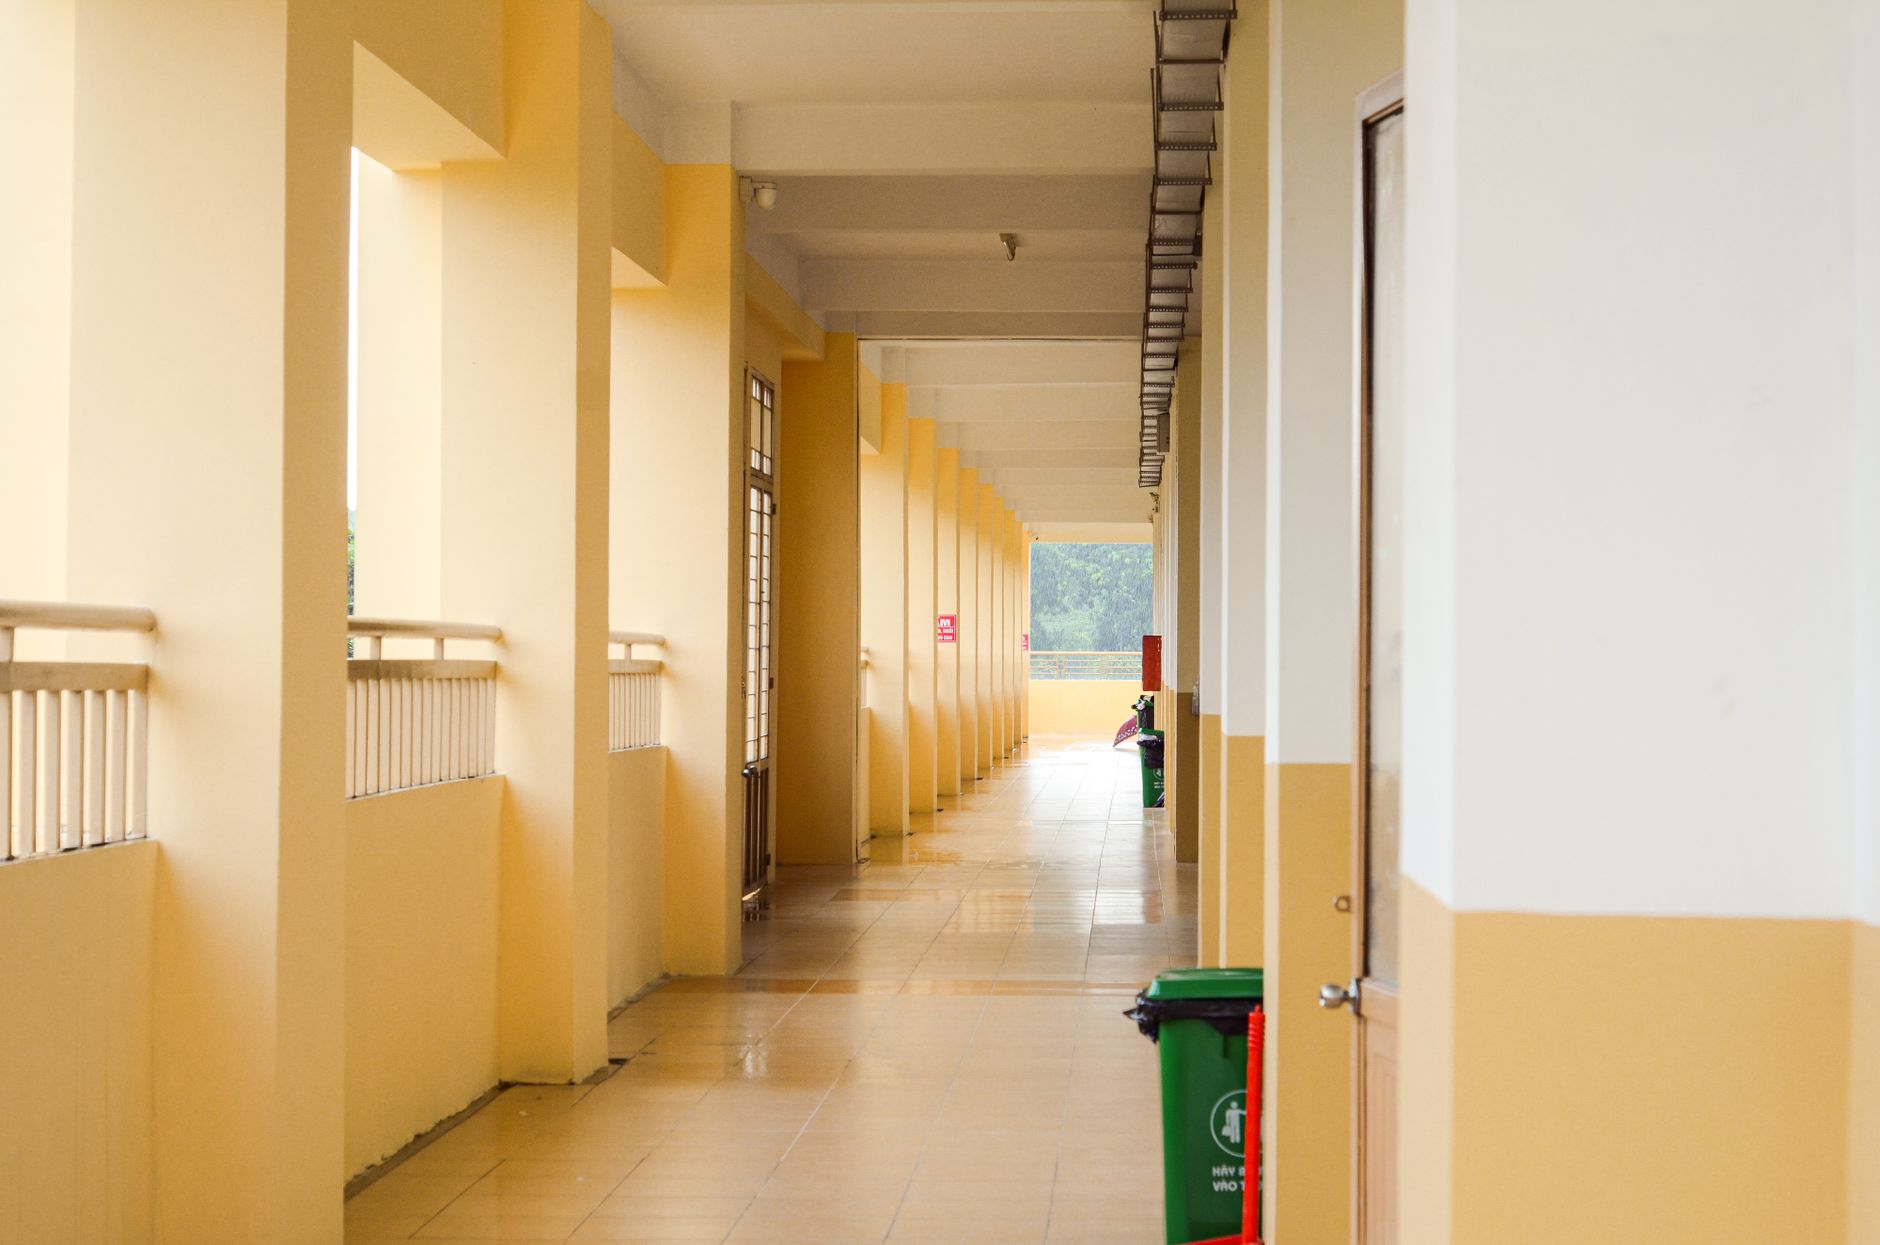
The return comes from a short list of repeatable floor jobs done on a schedule. Corridors and lecture halls carry heavy daily foot traffic and keep the same layout term after term, so a scrubber or sweeper can run the same route each night without a person steering it. The saving is the custodial hours that this routine work no longer needs, most of them on the night and early shifts, when the building is quiet and the floors are easiest to reach.
Two other sources matter at many campuses. Overtime and unfilled night shifts cost more than the hours alone, because a missed shift pushes the work onto whoever is left. Turnover is the third. According to a De Anza College custodial report from September 2020, staff cuts pushed the department to maintain Level 5 service, and further absences would drop service below that level. A robot that holds the routine passes steady gives the remaining crew room to protect that service level.
Median hourly wage, Janitors and Building Cleaners
$4,041
Monthly cost of one full-time worker, at the median wage plus payroll costs (an estimate, not a quote).
How does the savings math work?
The math has four inputs. First, the hours of janitors and building cleaners work that the robot takes over each week. Second, the share of that work it can realistically cover, which is almost never the whole floor. Third, the local wage for this job, which you can read in the government wage data panel on this page and which sets what an hour of that work is worth. Fourth, the lease payment, a fixed figure quoted after a site assessment, weighed against any overtime or coverage gaps the robot closes.
A simple version reads: hours covered, times the share the robot takes, times the value of an hour, plus avoided overtime, minus the lease payment. The result is a range, not a promise. The low and high ends differ because the hours and the share are estimates until the floor is mapped. A building where the robot takes most of a route is worth more than one where it covers a small part, even when the hours on paper match.

What hours does a robot take off the custodial shift?
Published hour counts for university floor work are thin, so treat any single figure with care. The best local evidence in this review is staffing, not hours. The De Anza College custodial program review from March 2016 lists 4 custodians on the day shift, 3 on swing, 7 on the early night shift and 8 on the night shift. A night crew that size is where scheduled routine passes are most worth absorbing, because those passes are predictable and repeat night after night.
Hour figures have to come from your own roster and floor layout. The sources reviewed here do not publish a typical number of hours a robot takes off a campus floor, so the site assessment counts the equivalent hours for each route. Until that count exists, any hour total is an estimate, and the savings range should say so.
| Task | Today | With a robot |
|---|---|---|
| Scrub hard-floor corridors on the night run | Part of an 8-person night crew at one college campus | Scheduled route, with a staff check at shift start |
| Sweep lecture hall aisles and lobby floors | Manual sweeping before the first class of the day | Run after the last class, with staff clearing the path first |
| Scrub recreation or dining hard floors | Manual floor machine time that the site assessment measures | Autonomous run, with staff handling spills and edges |
| Empty bins, pick up trash and wipe restrooms | Staff work through the shift | Stays with staff, the robot does not take it |
| Move chairs and clear the route before each run | Staff time before every manual scrub | Staff still clear the route, so this time does not disappear |
Staffing counts come from the De Anza College custodial program review of March 2016, a single campus and not a national average. Robot-side times depend on your floor layout and are set in the site assessment, so none are published here.
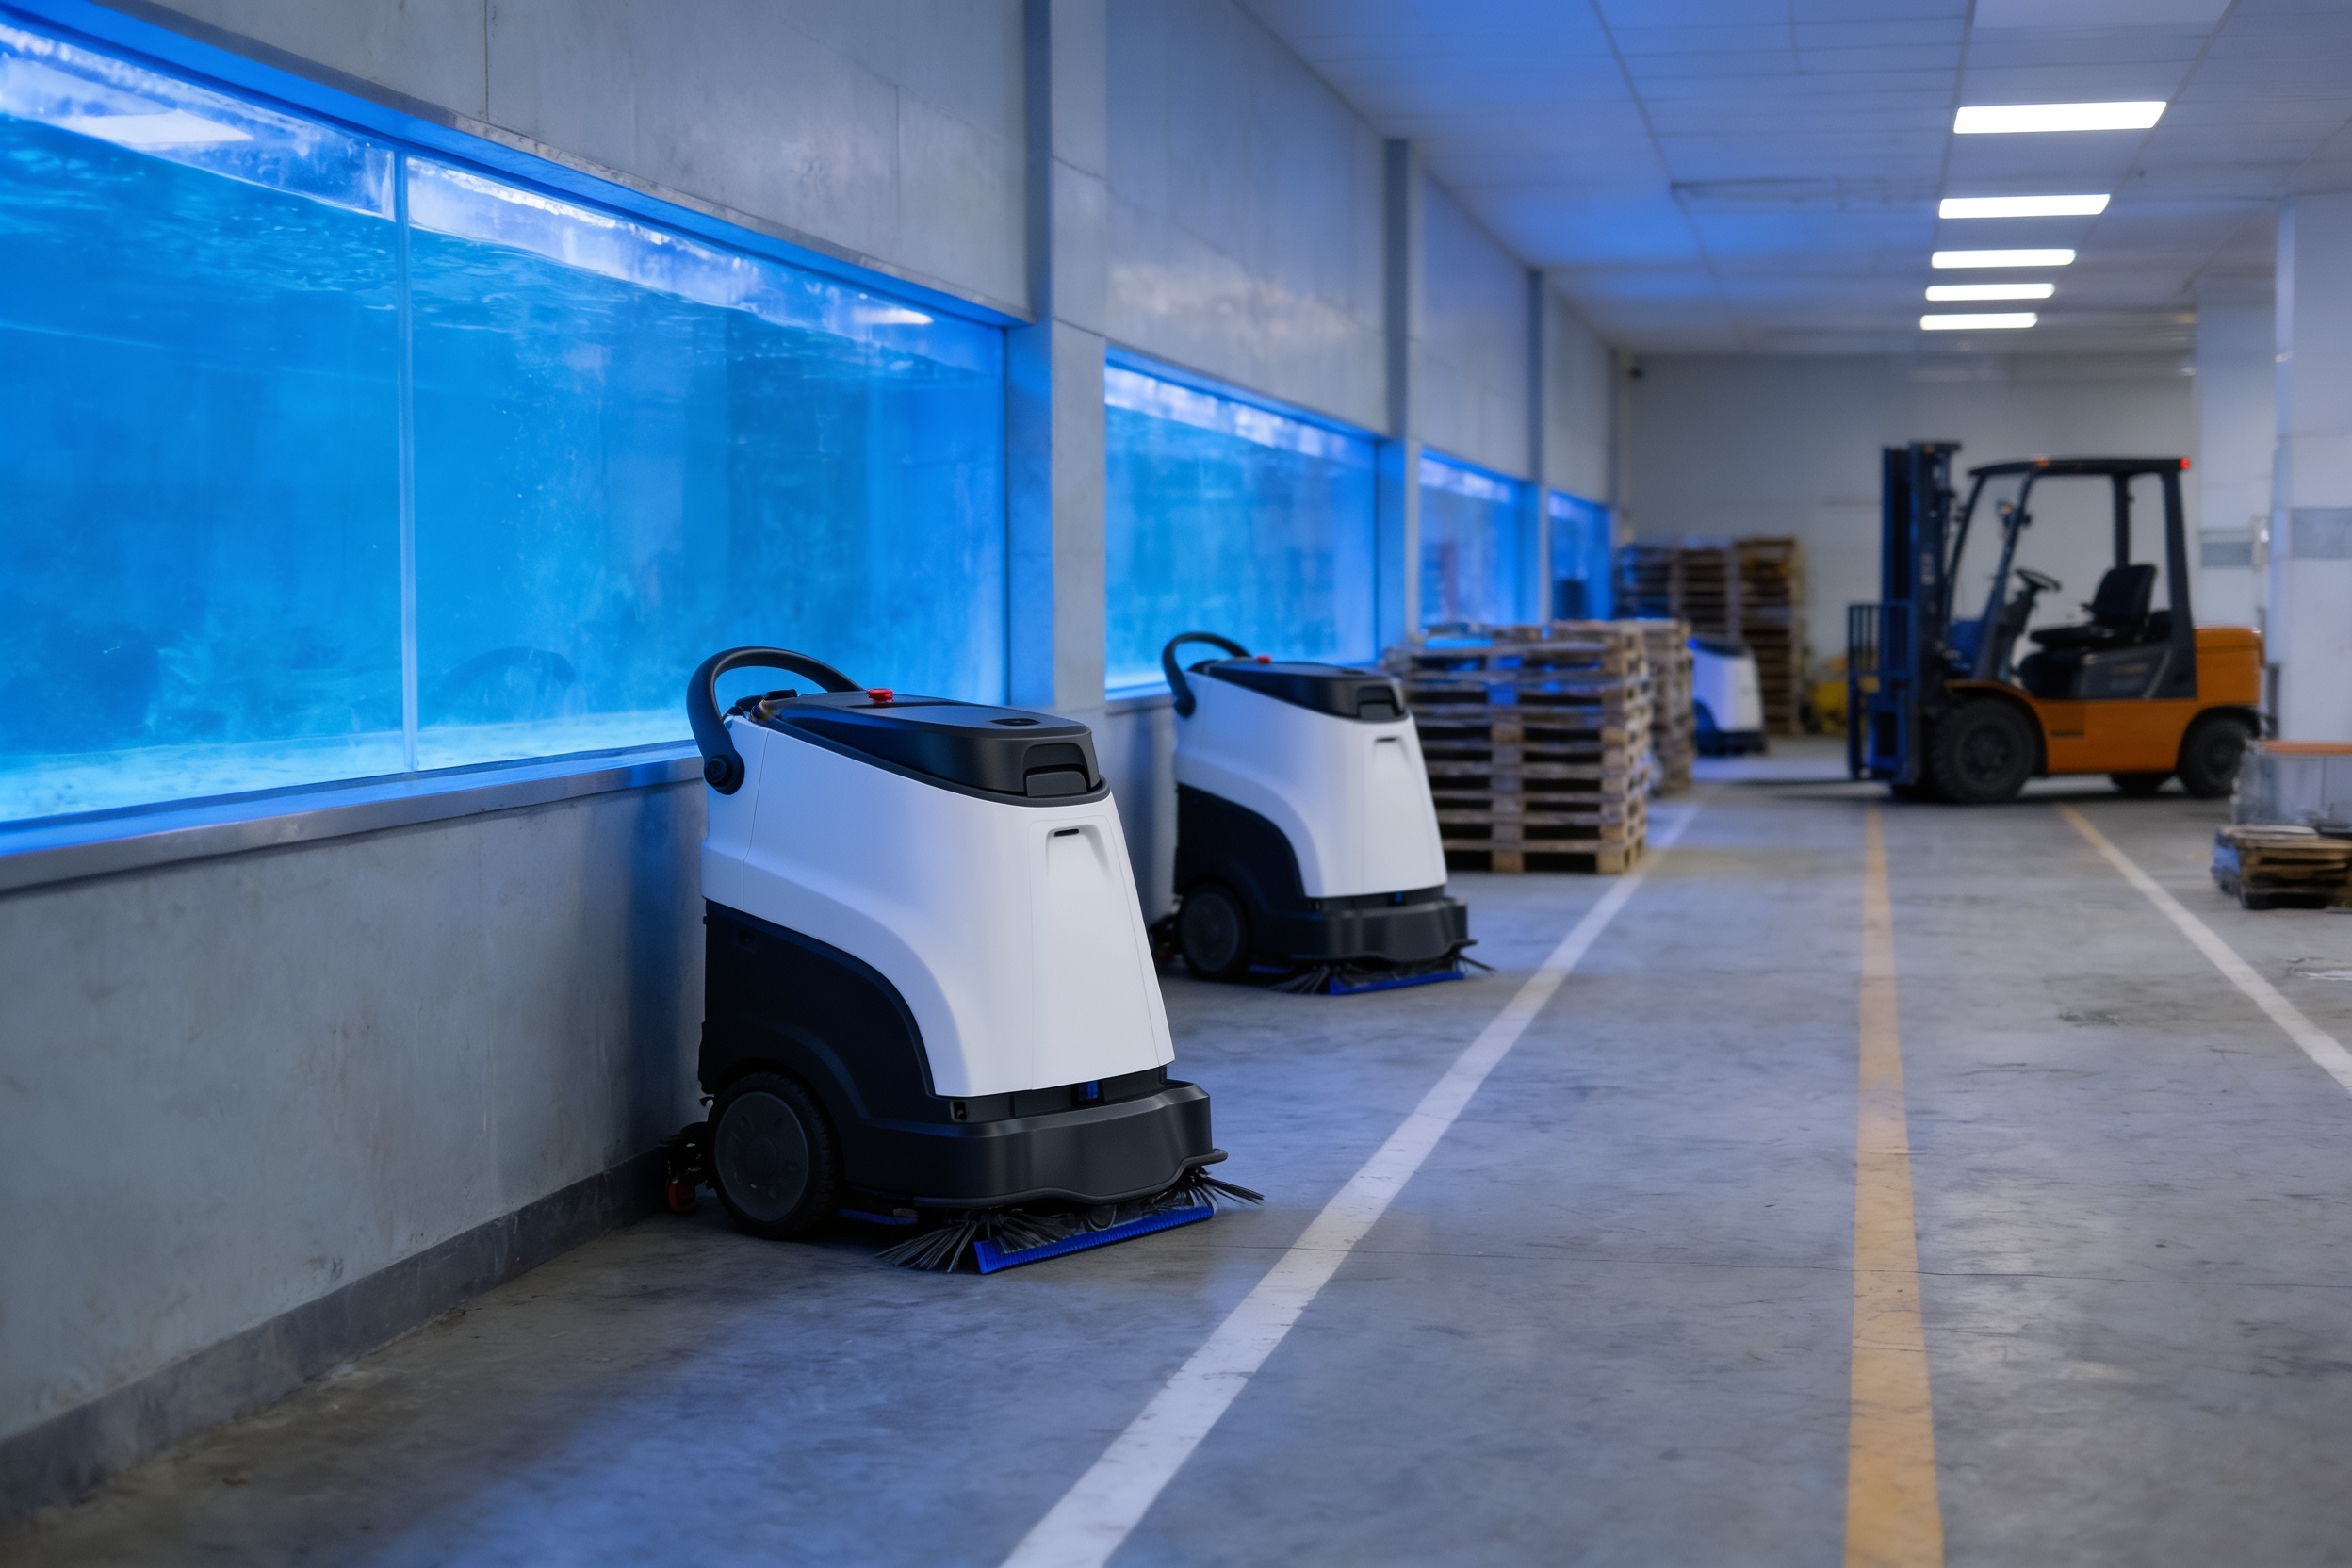
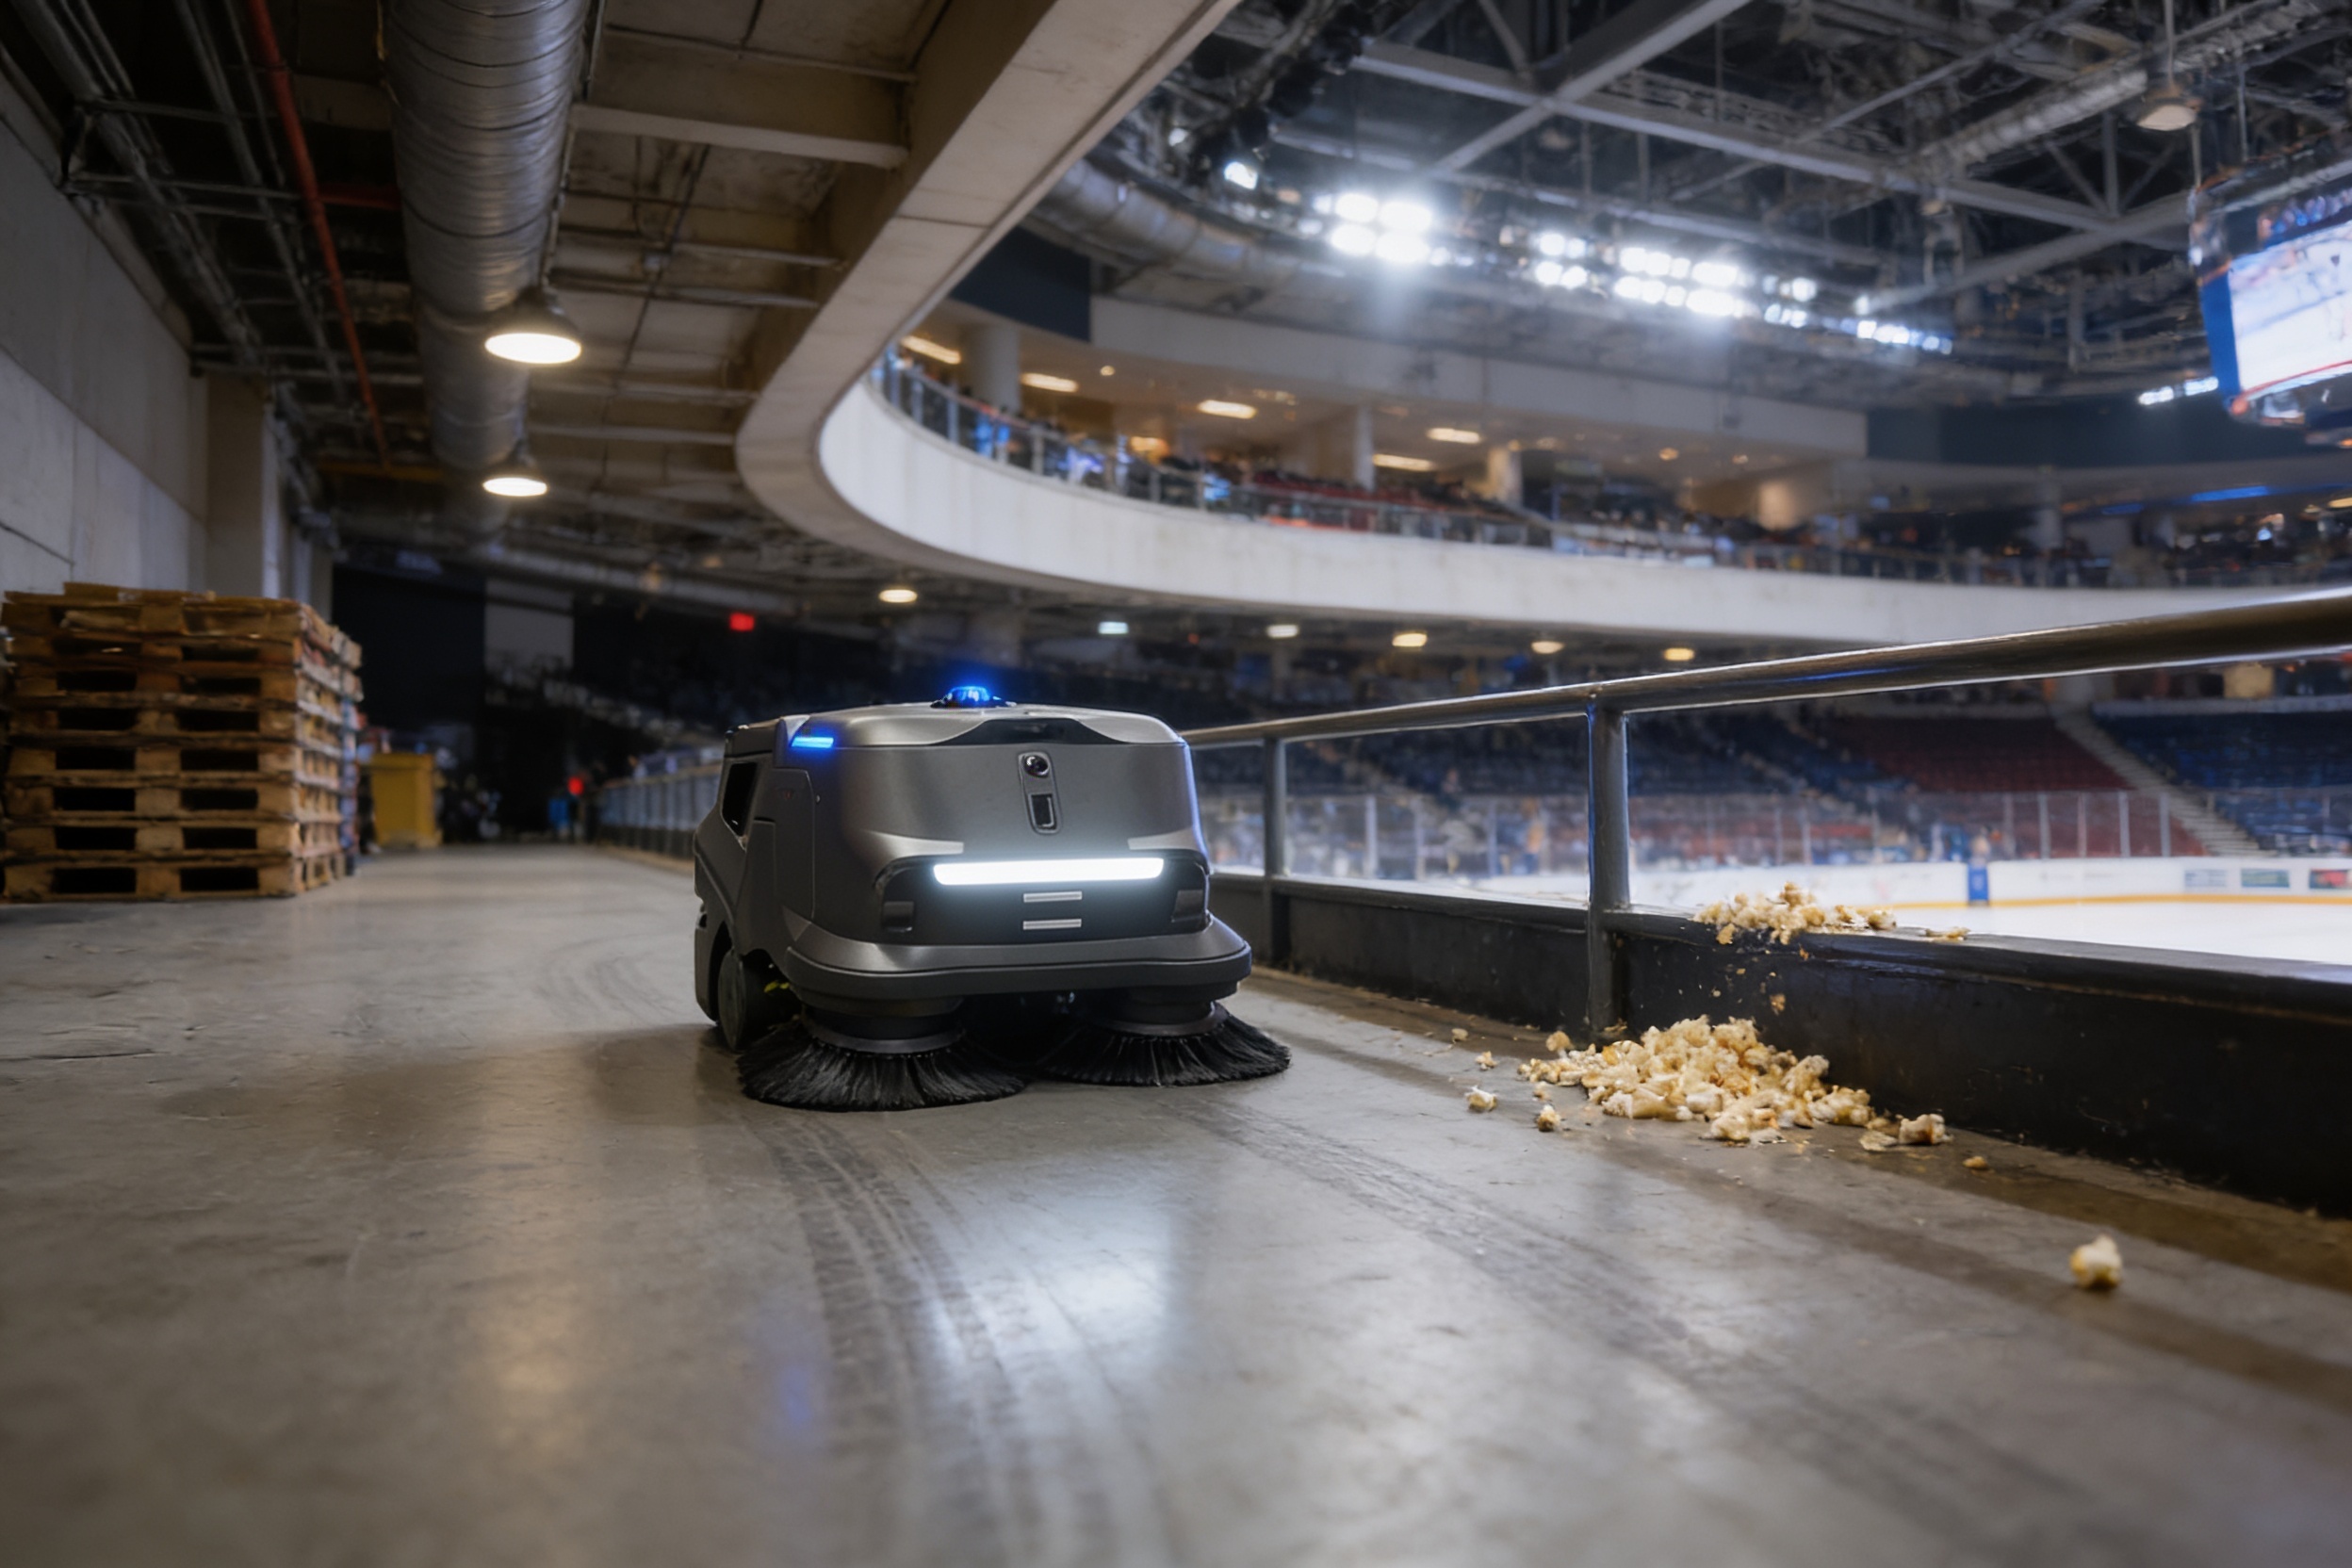
- Overnight consistency
Cleaning Robot
Runs the same mapped route at the same hour each night
Staff
Varies with shift, absence and fatigue
- Judgment on spills and debris
Cleaning Robot
Needs staff to clear the path and handle spills
Staff
Reads the floor, decides what to do and adapts
- Restrooms and trash
Cleaning Robot
Not part of the robot's work
Staff
Staff keep this work
- Blocked rooms and unplanned events
Cleaning Robot
Stops or reroutes when the path is blocked
Staff
Works around a blocked room, a broken fixture or a closed hall
- Coverage after an absence
Cleaning Robot
Runs unless the unit is down
Staff
Needs another person or overtime
- Stairs and uneven surfaces
Cleaning Robot
Limited to the mapped floor
Staff
Handles stairs, edges and uneven surfaces
What changes the university return up or down?
Turnover is the factor most people underrate. An APPA webinar on custodial retention, from the University of Oklahoma, says extra responsibilities, a lower pay range and a competitive job market produce high custodial turnover. It reports that after operational changes, turnover fell by 6 percent and 60 percent over the prior two years. The description does not give the method, so treat those figures as a direction rather than a benchmark.
Other factors move the number in both directions. Large floors with open routes raise the return. Carpeted, stepped or heavily cluttered areas lower it. A building with a single night crew changes how much a robot covering its routes is worth. Overtime rules and the count of unfilled positions matter too, although no study in this review links turnover to hours per shift, so that link is an assumption to test, not a finding.
What are the risks to the return and how do you avoid them?
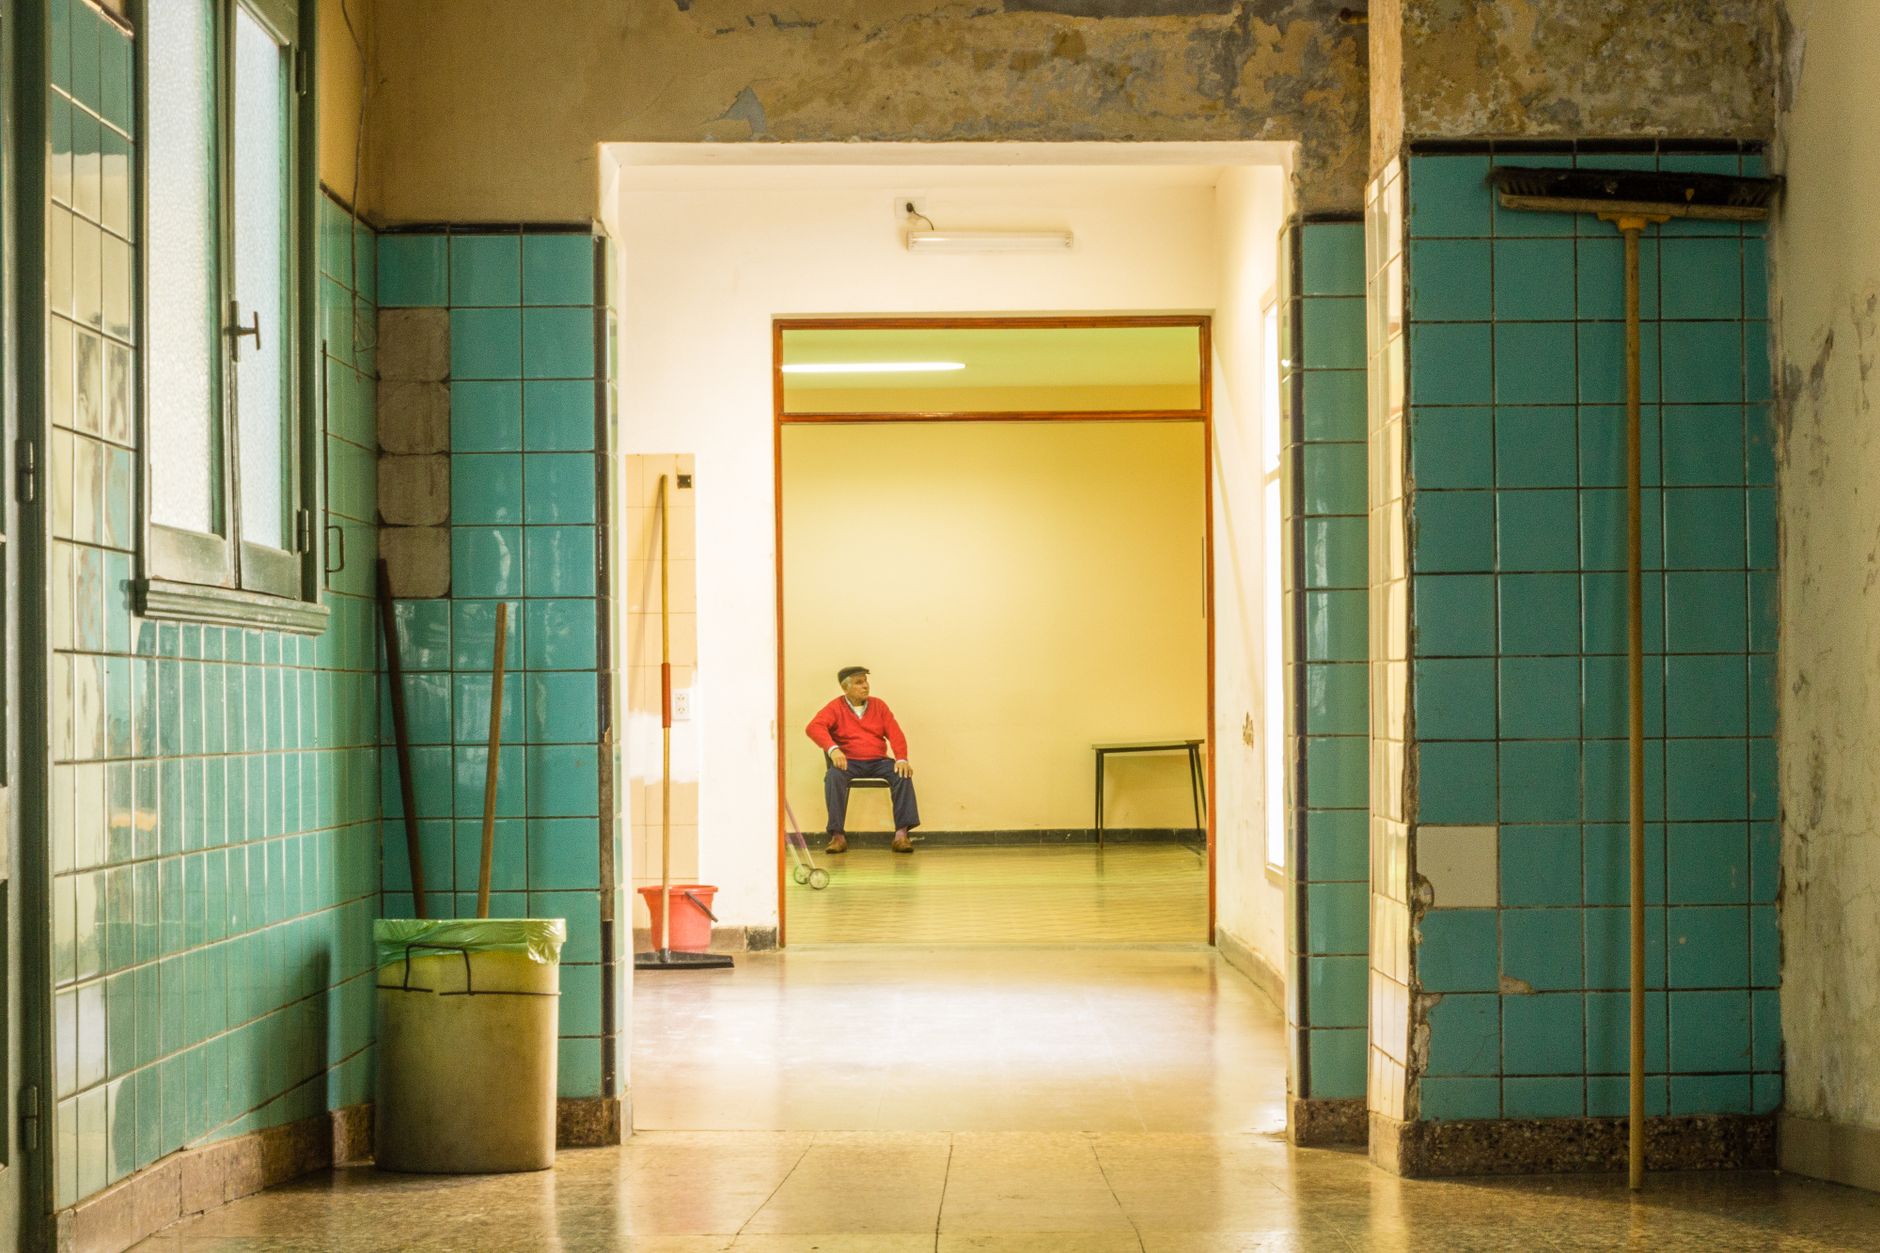
The biggest risk is service level drifting after the robot arrives. The De Anza College report from September 2020 shows how little slack a stretched crew has, since further absences would drop service below Level 5. A robot can hold routine floors steady, but only if the routes are maintained, the unit is serviced and someone checks the output each shift.
Avoid the common failures by planning for them. Start with one leased unit on the busiest routes. Train staff on setup, charging, blocked-path handling and the shift-start check. Agree on a backup plan for a unit that is down, such as spare-unit coverage where the site needs it. Our team picks the robot for the site, leases it through financing, deploys and integrates it, trains staff and services it nationwide, so setup and service stay in one plan rather than with separate vendors.
Does a cleaning robot reduce injury risk for custodial staff?
Custodial work carries real injury exposure. According to the Bureau of Labor Statistics, days-away-from-work rates for janitors and cleaners were 178.6 per 10,000 workers in 2016 and 176.6 in 2017, with later years on the same chart. The Bureau also reports 42 fatal injuries to this occupation in 2020, down from 45 in 2019.
Fewer manual machine hours can reduce exposure to repetitive strain and to handling heavy equipment, but no source in this review measures that effect on a campus. Treat injury reduction as a reason to review manual hours, not as a savings input. Keep it out of the payback math unless your own incident records support a figure.
What is a realistic timeline from assessment to payback?
The timeline runs in phases, and the lease term sets the window in which payback is measured. The first step is the free site assessment, followed by a written lease quote. Mapping, deployment, integration and staff training come next, then a go-live period in which the team checks output against the routine it replaces. The exact schedule depends on floor size, access hours and the building's term calendar, so this page gives no fixed number of weeks.
Expect the first shifts to show the most adjustment, as routes get refined and staff settle into the checks. Judge the result against the savings range from the assessment, not against the first week alone. Payback is a conclusion drawn from a period of running, so schedule the review before the lease starts.
- Free site assessment and floor mapping
- Lease quote with the fixed lease payment
- Deployment, integration and staff training
- Go-live period with output checks
- Payback measured across the lease term
How do you get a precise figure from a free site assessment?
A precise figure comes from your building, not from averages. The free site assessment maps the floor, counts traffic by route and time, records the existing shifts and their hours, and marks what the robot can and cannot cover. The output is a savings range built on your hours and your floor, plus a fixed lease payment quoted after that assessment.
Bring the hours by shift, custodial turnover and vacancy history, overtime records, floor types and the campus event calendar. We pick the right robot for the site, lease it through financing, deploy and integrate it, train staff and service it nationwide, so the number you sign off on comes from the site itself. Savings stay ranges, never promises, until operation confirms them.
Frequently asked questions
Want a cleaning robot at your university building?
Tell us about your site. We will recommend the robot, quote the lease, and keep it serviced.
Sources
- US Bureau of Labor Statistics, Occupational Employment and Wage Statistics (OEWS May 2024)
- U.S. Bureau of Labor Statistics, Occupational Outlook Handbook: Janitors and Building Cleaners
- National Center for Education Statistics, Fast Facts: Degree-granting institutions
- De Anza College custodial program review, March 2016
- De Anza College custodial and grounds maintenance report, September 2020
- APPA webinar on custodial retention
- U.S. Bureau of Labor Statistics, injuries and illnesses snapshot for janitors and cleaners, chart data 2020
- U.S. Bureau of Labor Statistics, fatal injuries snapshot for janitors and cleaners, 2016 to 2020