
The short answer
Cleaning robot ROI for bus terminals comes from taking the repeat floor passes between departure waves off the janitor and building cleaner hours on the schedule, minus the lease cost and the support time a person still needs. The savings range is a planning estimate, not a promise, and it moves with the open hard floor, the length of the gaps between waves, and how often passengers interrupt the route. A free site assessment measures those inputs and produces a lease quote.
Key takeaways
- The return comes from floor hours between departure waves, not from removing people from the building.
- The government wage data on this page sets the labor side, and the robot only takes janitor and building cleaner type hours.
- Cleaning turnover estimates vary widely, so base staffing on your own hiring records.
- Payback depends on the share of work the robot realistically covers and on the lease quote after a site assessment.
- Published bus facility counts are dated, so measure the floor in front of you instead of relying on national totals.
Run the numbers for your site
Pick your city or state for a real regional number - we use the real BLS wage there. (On the live site this auto-detects from your location.)
What do you want to automate?
The robot runs the open floor overnight; your crew keeps detail and edges.
What is the cleaning robot ROI for bus terminals?
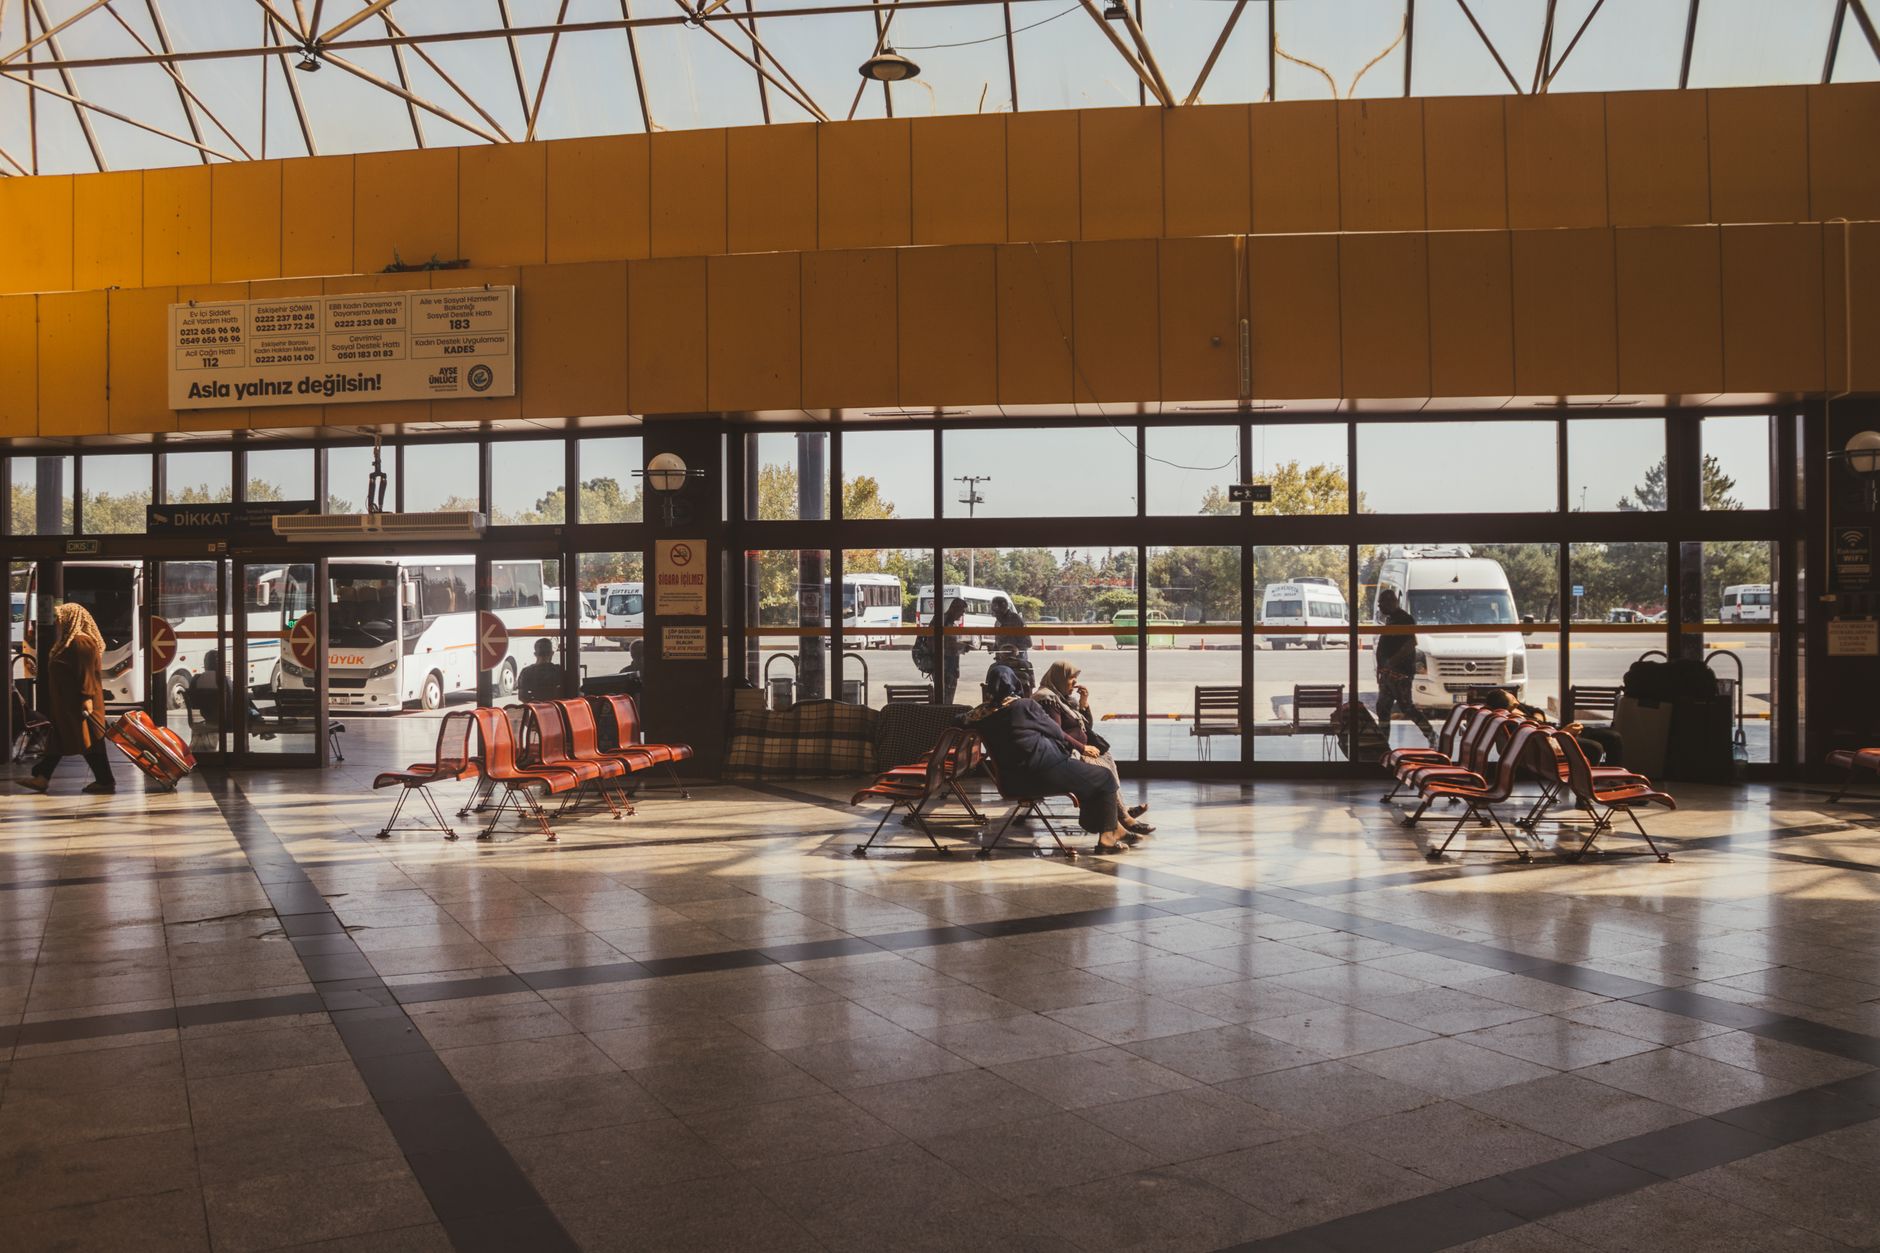
A cleaning robot ROI for bus terminals is the labor hours a robot takes off the crew, minus what the lease costs and what the staff still has to do. Bus terminals fit well when they have large hard floors, heavy foot traffic, and gaps between arrival and departure waves that let a scrubber run its route without blocking passengers. The return is strongest where the floor is open and the route repeats on each shift.
The number of these places is hard to pin down. The Bureau of Transportation Statistics reported 2,383 intercity bus facilities in its 2013 annual report, of which 266 were connected to other modes and 2,117 were not. Its 2014 database summary listed 2,421 intercity bus stops, 44 percent of them connected to other modes. These are the most recent counts the research for this page could confirm, and they describe intercity bus facilities rather than every transit terminal, so treat them as context and not as a market size.
What matters for your decision is the facility in front of you, not the national count. Floor area, the number of bays and platforms, and the schedule of waves set the return. The rest of this page explains how to measure each of them.
Where does the return come from at a bus terminal?
The return comes from repeat floor work done during the windows between departure waves. A scrubber or sweeper follows the same route on each shift, so the work is predictable, and predictable repeat work is what a robot handles well. The crew's time then goes to tasks that need a person, such as spill response, bag handling, and restroom service.
The labor side is priced on the local wage for this job, which appears in the government wage data panel on this page. That wage applies to janitors and building cleaners, so the robot offsets janitor and building cleaner type hours. Ticketing, dispatch, security and customer service staff keep their own work, and their time is not part of the savings math.
Hiring is part of the picture. The Bureau of Labor Statistics Occupational Outlook Handbook reports about 2.4 million jobs for janitors and building cleaners in 2024, with 2% projected growth from 2024 to 2034, which it describes as slower than average. It projects about 351,300 openings a year on average, so filling these roles is a recurring task for employers, not a one-time hire.
Median hourly wage, Janitors and Building Cleaners
$4,041
Monthly cost of one full-time worker, at the median wage plus payroll costs (an estimate, not a quote).
How is the savings range calculated?
The math has four inputs. The first is the labor hours a terminal spends on floor work the robot can take. The second is the share of those hours a robot realistically covers. The third is the lease cost, quoted after a site assessment. The fourth is the time a person still spends on setup, supervision, charging checks and exception handling. The savings range is the labor hours offset, multiplied by the share covered, minus the lease cost and the added support time.
The research for this page did not find a verified count of cleaning staff at one bus terminal. For planning, this page uses four people as a placeholder headcount, and that number is an assumption, not a measured count. Replace it with the crew schedule from your own terminal before you rely on any figure.
Put simply, if the crew spends a large share of its hours on scheduled floor passes that a robot can run, the offset is large. If most of the crew's day goes to spills, restrooms and bags, the offset is small, and the lease has to be justified by the hours it does take.
| Task | Today | With a robot |
|---|---|---|
| Scrub the main concourse between waves | crew hours set by the existing schedule | runs in gap windows after a short setup at shift start |
| Sweep the bus bay apron | a crew pass each shift, timed during the walk | robot pass in open windows, with staff clearing debris first |
| Scrub the waiting hall and ticketing lobby | repeat crew passes measured during the assessment | fixed route on the same path every shift |
| Spill response and bag handling | crew time, unchanged by the robot | stays with staff |
| Restroom cleaning | crew time, unchanged by the robot | stays with trained staff |
Published hour figures for bus terminal cleaning were not found in the research for this page. Enter your crew hours from the schedule. The robot side is measured on your floor during the site assessment.
How much of the floor work can a robot realistically take?
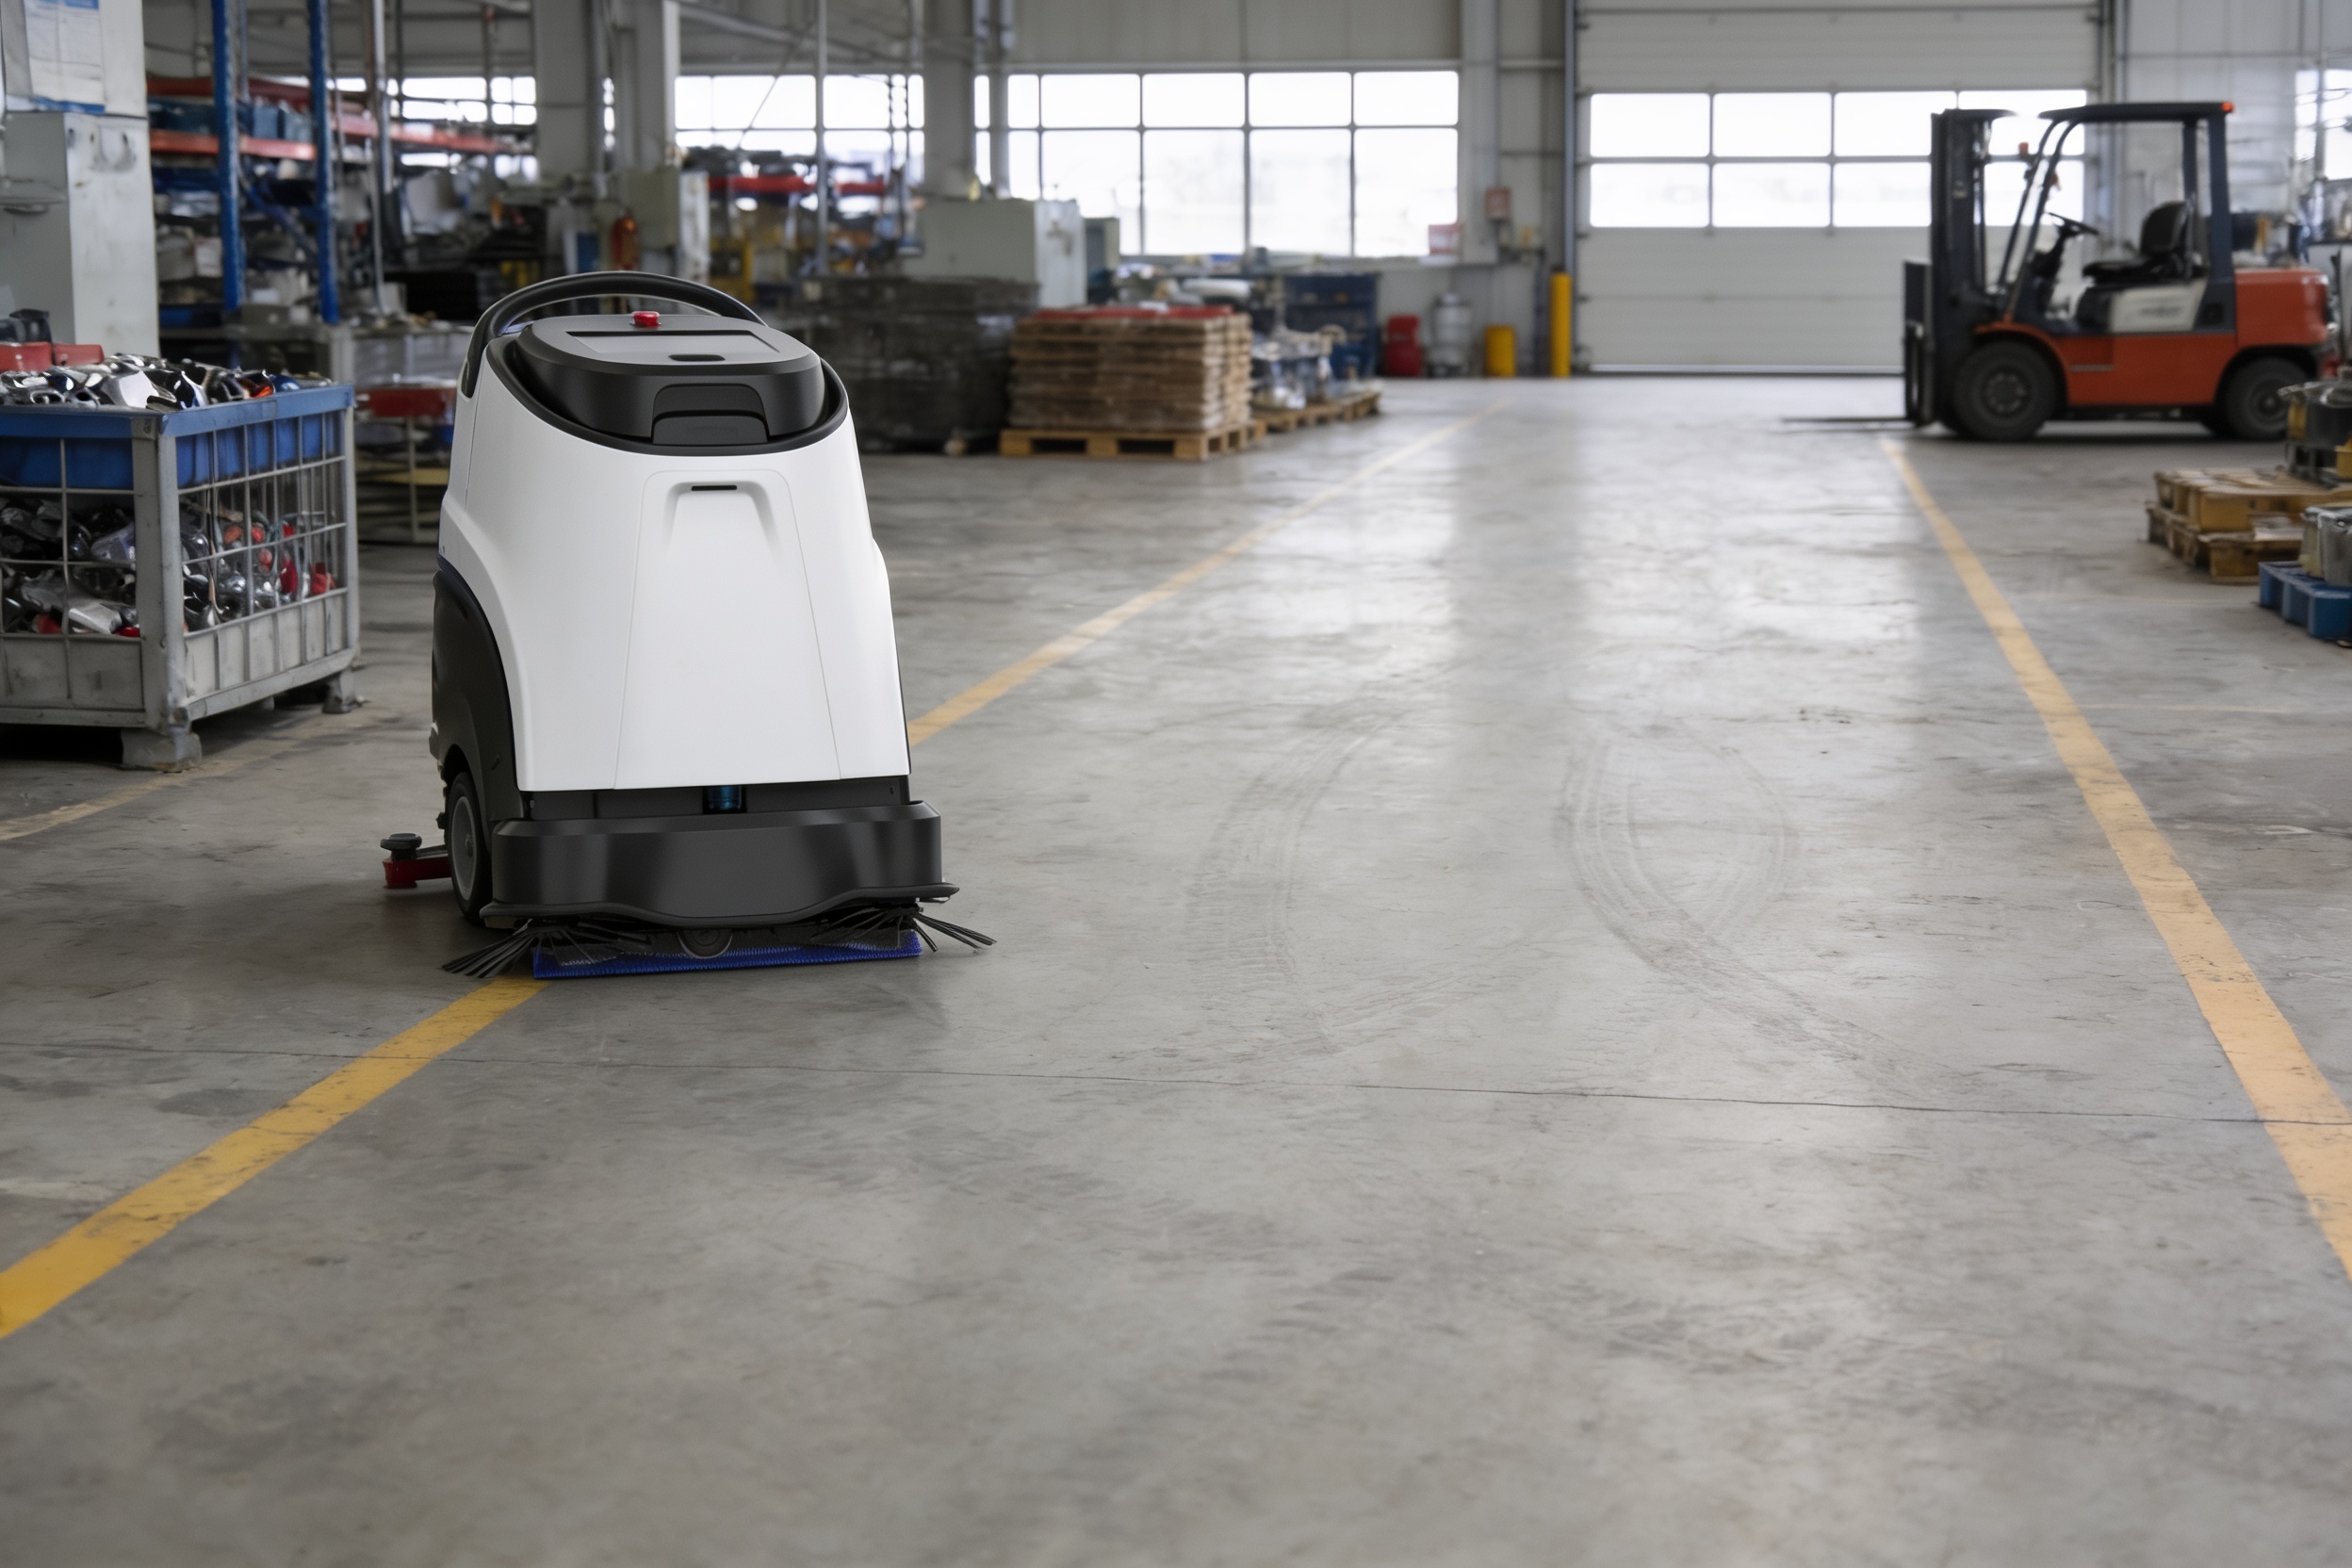
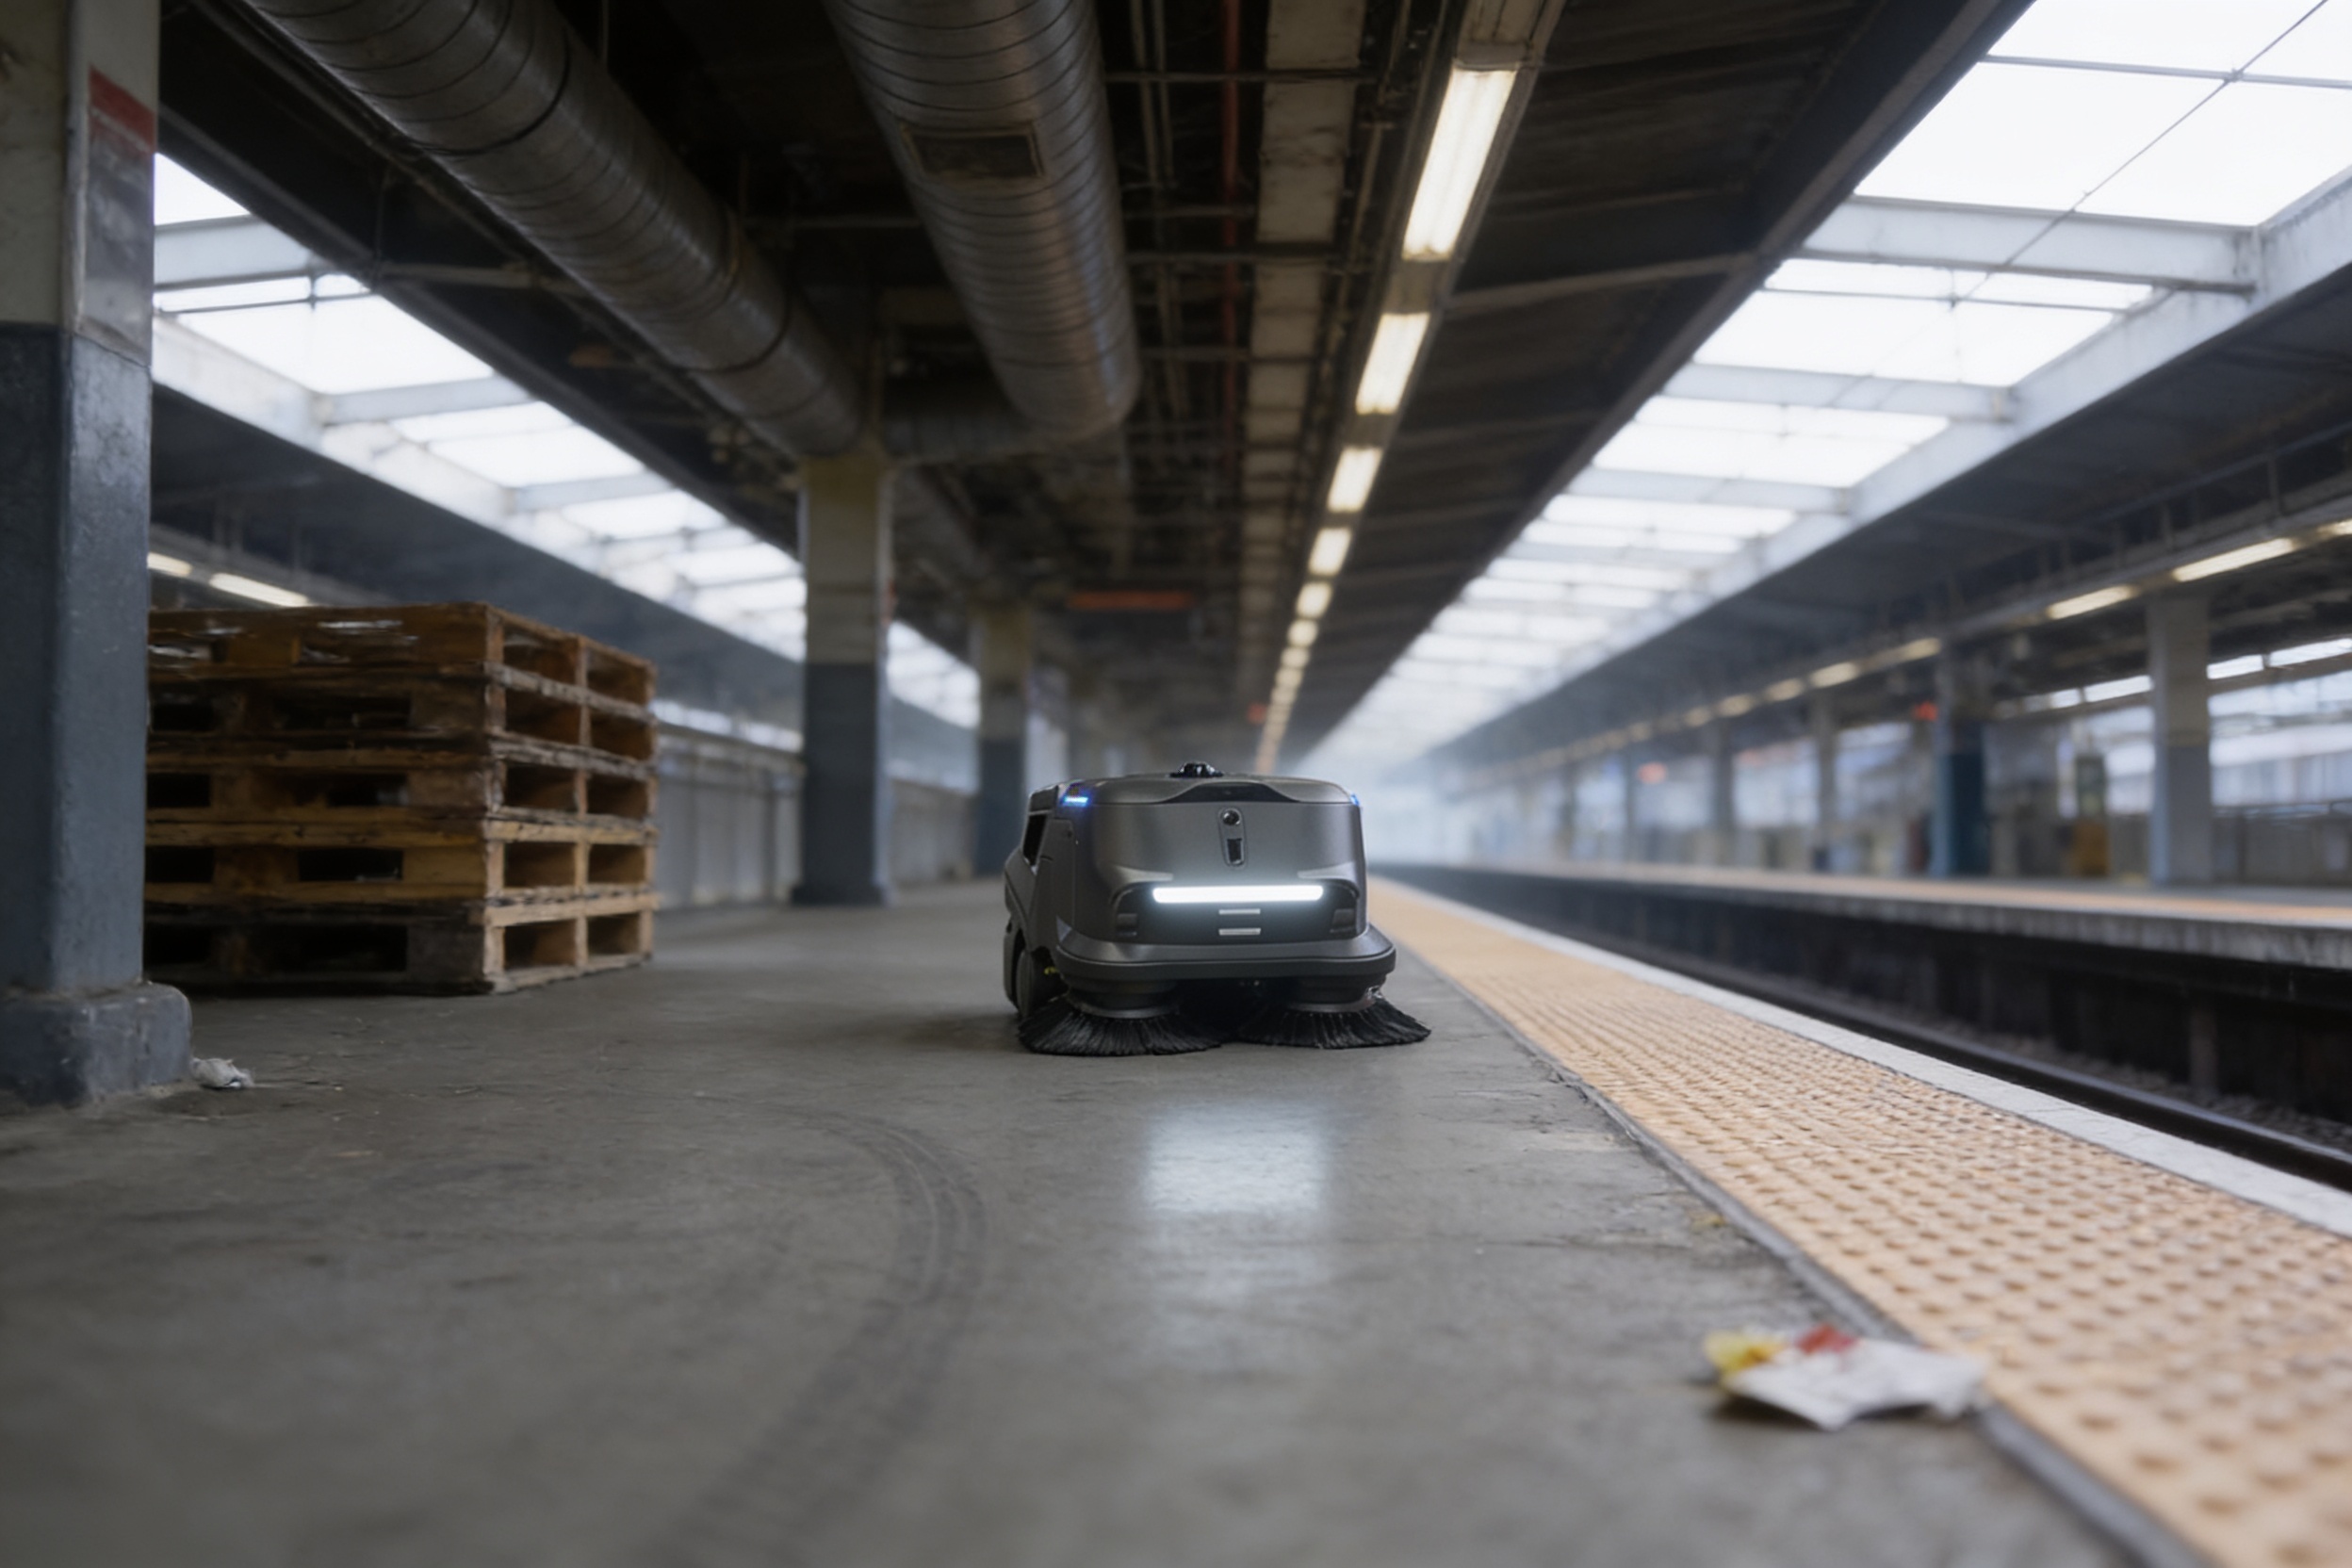
A realistic share is smaller than the total floor hours on the schedule. A robot suits open hard floor on a fixed route, scrubbing or sweeping between waves. It suits poorly work that changes every few minutes, such as cleaning up a spill near a boarding gate or working around a crowd that has not cleared.
Adoption data suggests most operators are still early. A 2019 period industry survey reported that 68 percent of respondents answered no when asked whether they use autonomous or robotic cleaning equipment. The AACEM and ISSA autonomous cleaning survey from 2019 described adoption as an early stage, and about one-third of non-adopters said they were somewhat likely to adopt within a year. The full AACEM and ISSA report is restricted to members, so the figure here comes from its public description.
Set the share from the route, not from a general estimate. Walk the floor with the crew during a wave, mark what is open and what blocks the route, and count how often the route is interrupted. The day timeline below shows what a sample shift looks like once the share is set.
What changes the number up or down?
Staff turnover is one of the largest swings. Cleaning turnover estimates vary widely, and most come from industry surveys or vendor blogs rather than government statistics. A reader survey run by a cleaning industry publication found an average turnover of 73 percent, while the figure most often cited in industry talk is about 300 percent. A vendor blog on janitorial staffing says janitorial and cleaning annual separation rates regularly exceed 50 percent. A second vendor blog puts janitorial turnover between 75 and 375 percent a year.
The spread is the lesson. High turnover raises recruiting and training costs and makes the crew's knowledge of the route fragile. A robot that runs a fixed route does not depend on who was hired last week, which is a real benefit that is hard to reduce to a single hour figure. Count it in the assessment, but do not inflate the savings range with it.
Other factors move the number as well. Floor area and route length set how many hours one pass takes. The number of gaps between waves sets how much work fits in each window. Peak wave timing that shifts through the year changes the schedule, and restroom and spill duties that stay with staff keep the offset smaller.
What are the risks to the return, and how do you avoid them?
The biggest risk is overestimating coverage. A plan that assumes the robot covers all the floor work will disappoint, so start with the share from the route walk and test it in a pilot before committing to the full floor.
The second risk is a route that blocks passengers. Peak waves are when the floor is most crowded, so the schedule must keep the route clear during boarding. Map the terminal with the crew, set no-run zones, and review them after every schedule change.
Safety is the third risk. Restroom cleaning carries bloodborne pathogen exposure, and floor equipment carries electrical hazards. Keep restrooms with trained staff, treat charging and battery handling as part of training, and teach the crew when the robot should stop and wait.
Downtime is the fourth risk. A unit out of service during a wave returns no hours. Ask how service is dispatched and how quickly a remote issue is triaged before you sign.
What is a realistic timeline from assessment to payback?
The sequence runs from a site assessment, to a mapped route and a lease quote, to deployment and integration, to staff training and go-live support, and finally to a review of measured hours against the savings range. Each stage depends on the terminal, so the timing should come from the assessment and not from a general estimate.
Payback is reached when the measured labor offset, net of lease cost and support time, has covered the lease over its term. Because the offset is a range, expect the first review to refine the share of work the robot takes. Plan that review in advance, and track hours before and after go-live using the same schedule so the comparison holds.
We deploy and integrate the robot, train the staff who will work alongside it, and provide go-live support. Our service covers units nationwide, with on-site dispatch and remote triage for issues.
Where does a person still beat a robot in a bus terminal?
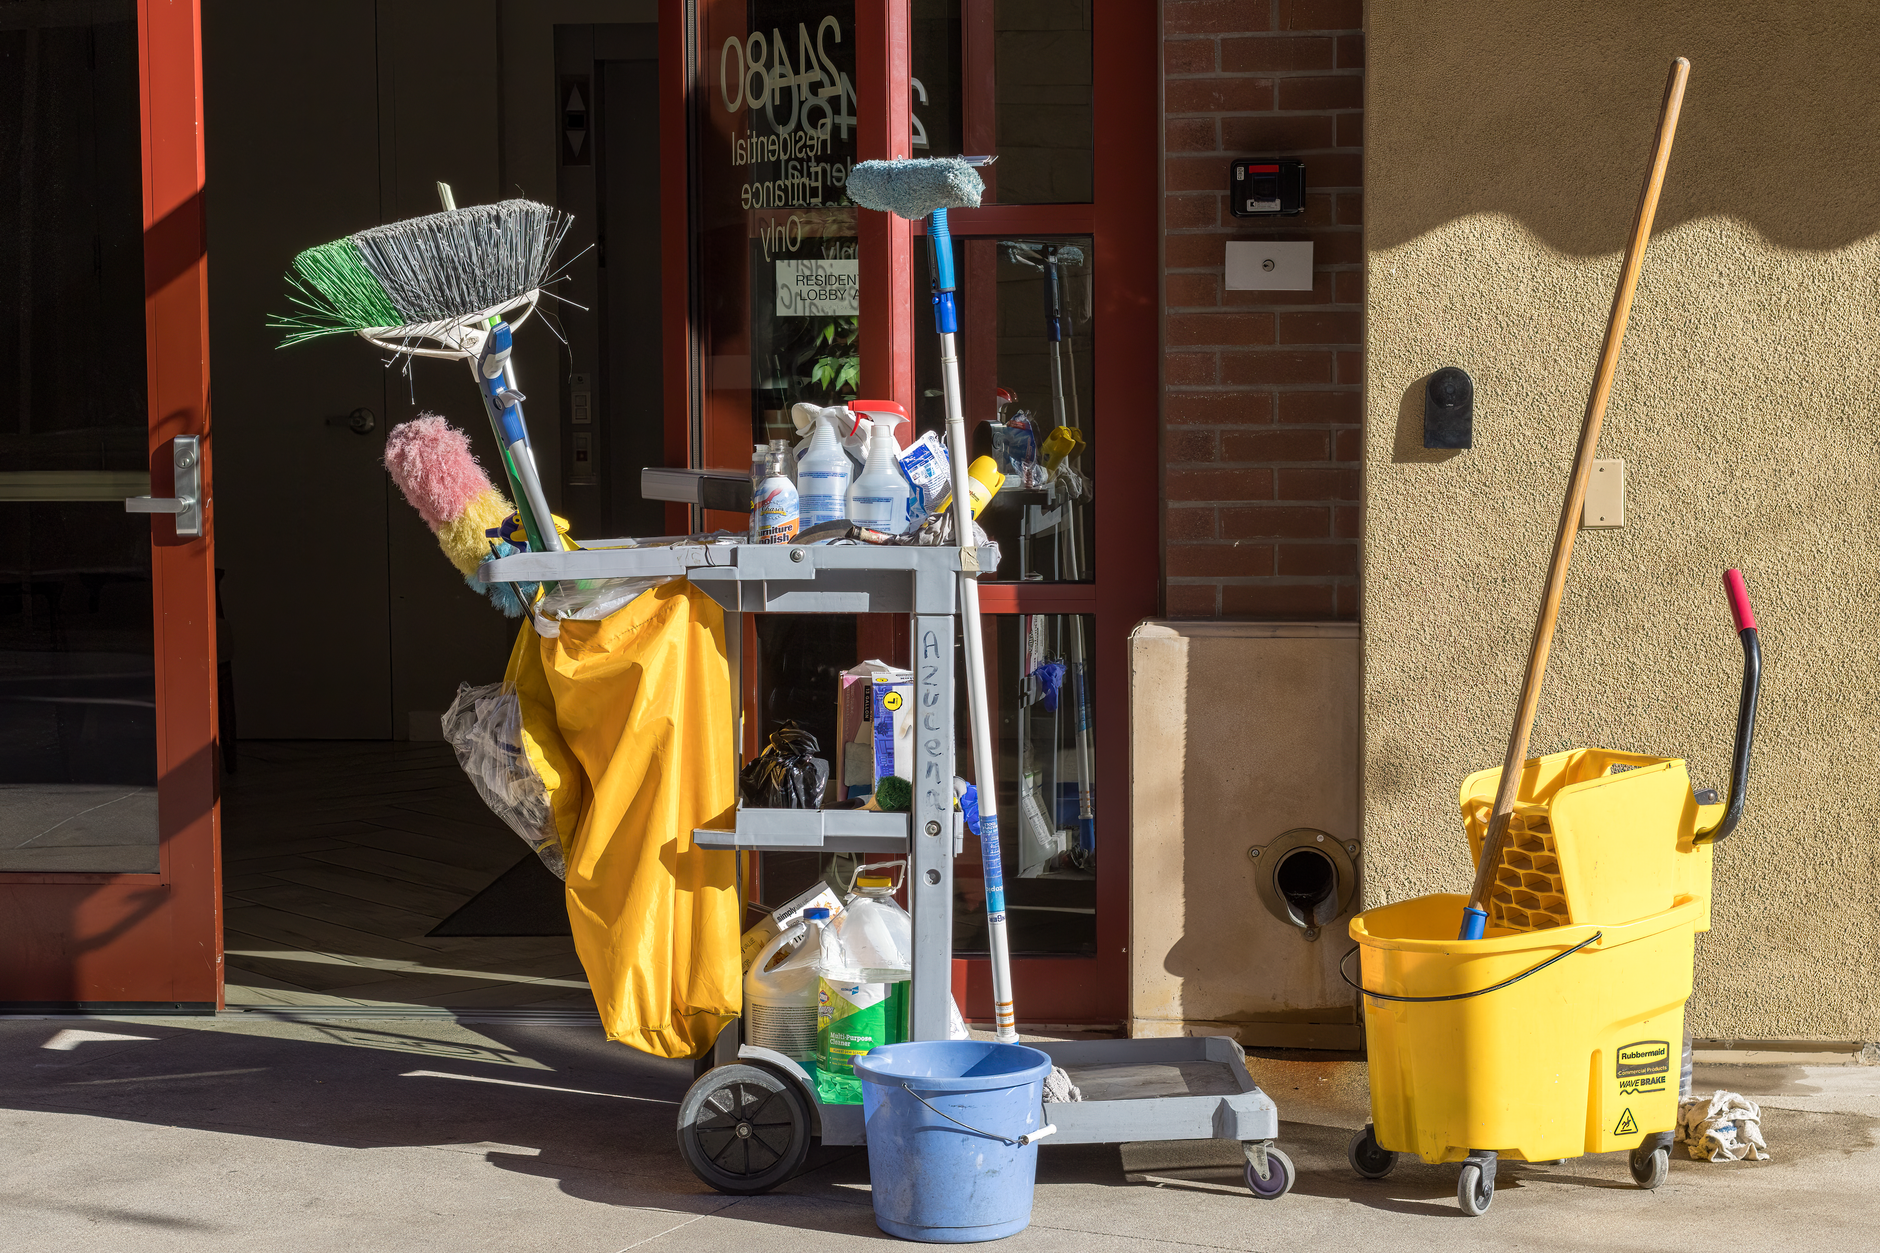
People win on anything that changes minute to minute. Spill response, bag handling, helping passengers with mobility needs, reporting damage, restroom service and cleaning around a crowd all need judgment and presence. A robot cannot make those calls, so the crew stays on those tasks.
The robot wins on repeat, predictable passes at fixed times, and on keeping the route the same on every shift no matter who is on duty. It runs the same pass at the end of a long shift as at the start. These are real operating advantages, but they only pay off when the route is open and the schedule has gaps.
How do you get a precise figure from a free site assessment?
A precise figure comes from measurement. The assessment maps the floor, records open hard floor area and route length, times the gaps between waves, and collects the crew's hours for the tasks in scope. It also identifies no-run zones and charging locations.
We pick the right robot for the site, lease it through financing, deploy and integrate it, train the staff and service it nationwide. The lease payment is quoted after the free site assessment, so you see the cost against the hours the robot can actually take, not against a generic estimate.
Bring the crew schedule, the wave timing, and any floor plan you have. The more accurate those inputs are, the tighter the savings range becomes.
Frequently asked questions
Want a cleaning robot at your bus terminal?
Tell us about your site. We will recommend the robot, quote the lease, and keep it serviced.
Sources
- US Bureau of Labor Statistics, Occupational Employment and Wage Statistics (OEWS May 2024)
- BLS Occupational Outlook Handbook: Janitors and Building Cleaners
- Bureau of Transportation Statistics, 2013 annual report, intercity bus facilities
- Bureau of Transportation Statistics, 2014 database summary of intercity bus stops
- Industry publication reader survey on cleaning turnover
- Vendor blog on janitorial and cleaning separation rates
- Vendor blog on janitorial industry turnover ranges
- 2019 period industry survey on autonomous and robotic cleaning use
- AACEM and ISSA autonomous cleaning survey (2019)