

The short answer
An autonomous mobile robot ROI for shipyards comes mainly from taking repeated, mapped hauls of plate, pipe and parts between fabrication and assembly bays off the hours that laborers and freight, stock, and material movers, hand spend on them. The savings range depends on the share of those moves a robot can realistically carry, the number of shifts it covers, and a fixed lease payment that is quoted after a free site assessment. Treat the calculator result as a planning range until the assessment measures your own routes.
See what a autonomous mobile robot costsRun the numbers in the ROI calculator
Key takeaways
- The return comes from repeated, scheduled hauls between bays, not from one-off lifts.
- Savings are a range set by the share of moves a robot can take and the shifts it covers.
- Shipyard labor is hard to hold, so every hour freed from hauling counts for more in staffing terms.
- Route repeatability, floor condition and crane windows change the number more than the robot model does.
- A free site assessment replaces the calculator's assumptions with timed, measured routes.
Run the numbers for your site
Pick your city or state for a real regional number - we use the real BLS wage there. (On the live site this auto-detects from your location.)
What do you want to automate?
The robot takes the repetitive cart and pallet moves off the heaviest motion.
What is the ROI of an autonomous mobile robot for shipyards?
An autonomous mobile robot ROI for shipyards is the return from moving heavy material on a robot instead of on labor hours. The setting is large. The MARAD 2013 economic study counted 117 active shipbuilding yards in 26 states, using 2011 data, with 107,240 direct jobs. It also found that 62 percent of private direct shipbuilding employment sat in five states: Virginia, Louisiana, Mississippi, Connecticut and California.
A later MARAD study, using 2013 data, counted 110,390 direct jobs and reported total activity, including indirect and induced effects, at 399,420 jobs. The yard count in that later study was not in our research, so the 117 figure is the most recent yard count we could source, and it reflects 2011 data. National totals are useful for scale. The return is decided one yard at a time, by how much material moves and how many hours that movement takes.
Why does hauling take so much of a yard's time?
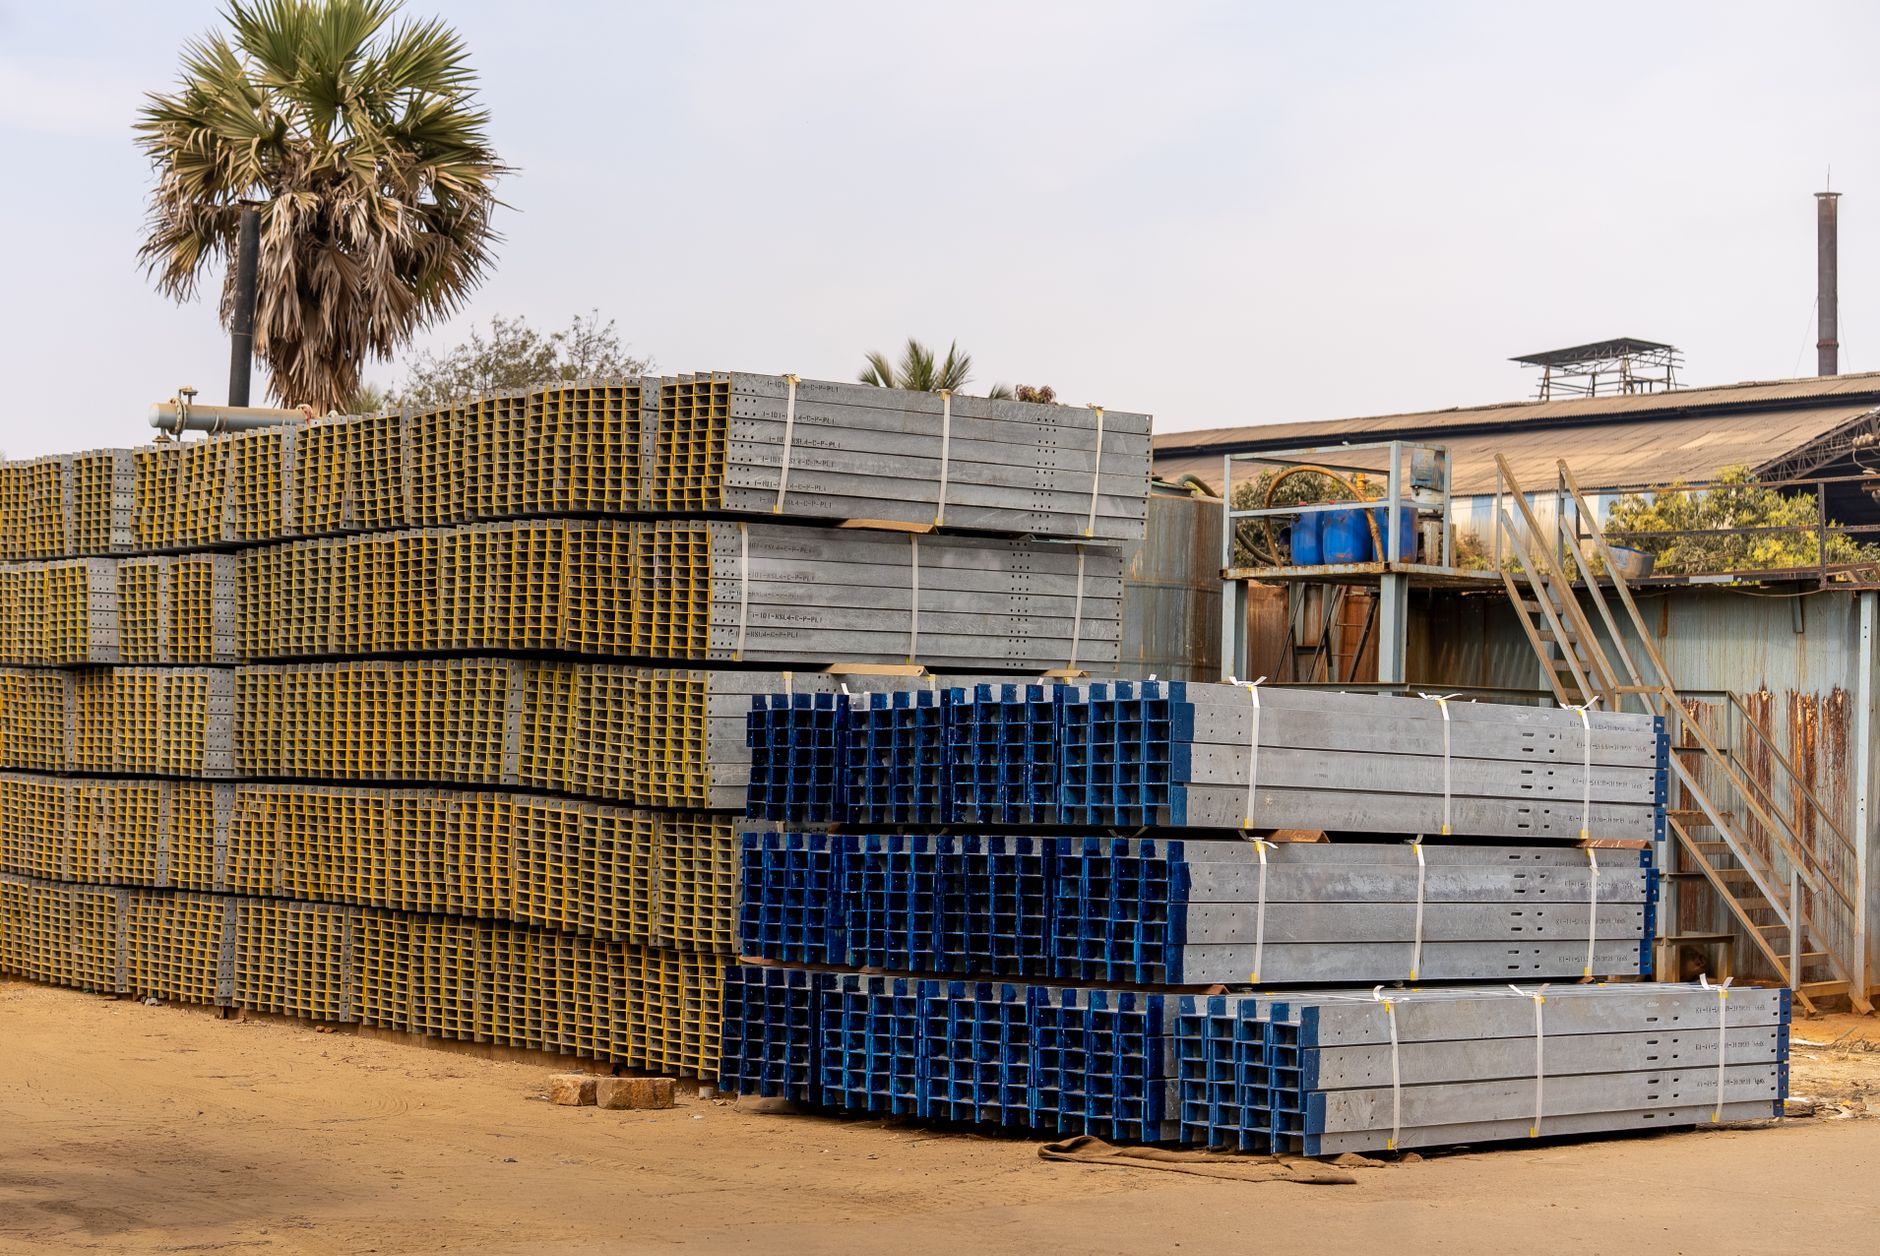
A yard's material moves in long, repeated loops. Plate comes out of storage, goes to a cutting or forming bay, then moves on to subassembly and the hall where blocks are built. Pipe and fittings follow similar paths. Each leg is short on its own, but the same legs repeat for every panel and block, so the hours add up across a shift.
The best public evidence on this is a modeling study, not a field count. A Danish university study from 2003 modeled crane scheduling for plate storage at one yard and estimated a potential 67 percent reduction in movements and a 39 percent reduction in time against current practice. The authors present these as modeled results, not observed ones, so read them as a direction, not a forecast for your yard.
We found no published field time study giving hours per shift for moving plate or pipe between bays. A teaching exercise assumes four moves per plate at three minutes per move. That is an assumption, not field data, and the calculator asks for your own timed routes to replace it.
Median hourly wage, Laborers and Freight, Stock, and Material Movers, Hand
$4,380
Monthly cost of one full-time worker, at the median wage plus payroll costs (an estimate, not a quote).
Where does the return actually come from?
The return comes from labor hours that move off the people doing the hauling and onto a robot that runs the same route on a schedule. In this setting the work is laborers and freight, stock, and material movers, hand type work. The government wage data on this page gives the local wage for that job, and the calculator values the hours a robot takes over at that wage. We do not price the time of any other role.
Most yards also have a staffing problem. Hauling crews are often short, and a route that needs covering at night or on a weekend either waits or pulls someone off another task. A robot that runs a mapped loop in off hours adds coverage that does not depend on filling a shift, and that coverage has value even before the wage math is done.
For planning, this page assumes about 20 people do this kind of work at one yard. We found no published count of material movers per yard, so that figure is an assumption. The site assessment replaces it with your own roster.
How does the savings math work?
Start with hours. Take the weekly hours your crews spend on qualifying runs, meaning repeated, mapped routes that do not involve rigging or hand finishing. Multiply by the share of those runs a robot can realistically carry, which is almost never all of them. Convert the result to cost using the government wage data for the job, with the employer load added as your finance team defines it.
Then subtract the fixed lease payment and any service or integration cost that falls in the same period. The gap is the savings range. The calculator shows a low and a high case, because both the share of runs and the time on each run are uncertain until they are measured. A range is an honest output. A single number is a claim the assessment has to back up.
In plain terms, with no figures from us: hours covered, times share taken, times the wage, minus the lease and service cost, gives the return for the period. Each term is a measured input, so the result moves when the measurements do.
| Task | Today | With a robot |
|---|---|---|
| Plate from storage to cutting bay | measured at assessment, not published | scheduled mapped run, staff load and unload |
| Pipe and fittings to subassembly | timed at assessment | scheduled run, crew confirms the job kit |
| Parts back from fabrication to staging | timed at assessment | run in off hours where shifts allow |
| Empty carts and dollies returned | timed at assessment | robot returns units to the start point |
No published field hour figures were found for these tasks, so the page does not estimate them. The site assessment times each route. The 67 percent figure in this section's neighbor is a modeled crane result and is not used here.
What changes the number up or down?
Route length and repeatability move the number most. A loop that runs every shift is a better candidate than a one-off lift that needs a crane. Floor condition, gradients and door widths come next, because they decide which lanes the robot can use and how quickly it moves through them. Crane and overhead interaction matters too, since a robot that waits on every lift returns fewer hours than the plan assumes.
Shift coverage matters as well. A robot that runs overnight or on a second shift adds hours that did not exist before, and that moves the result more than swapping hours inside the day shift. The checklist below lists what to confirm before you accept any range.
How hard is it to keep people on shipyard work?
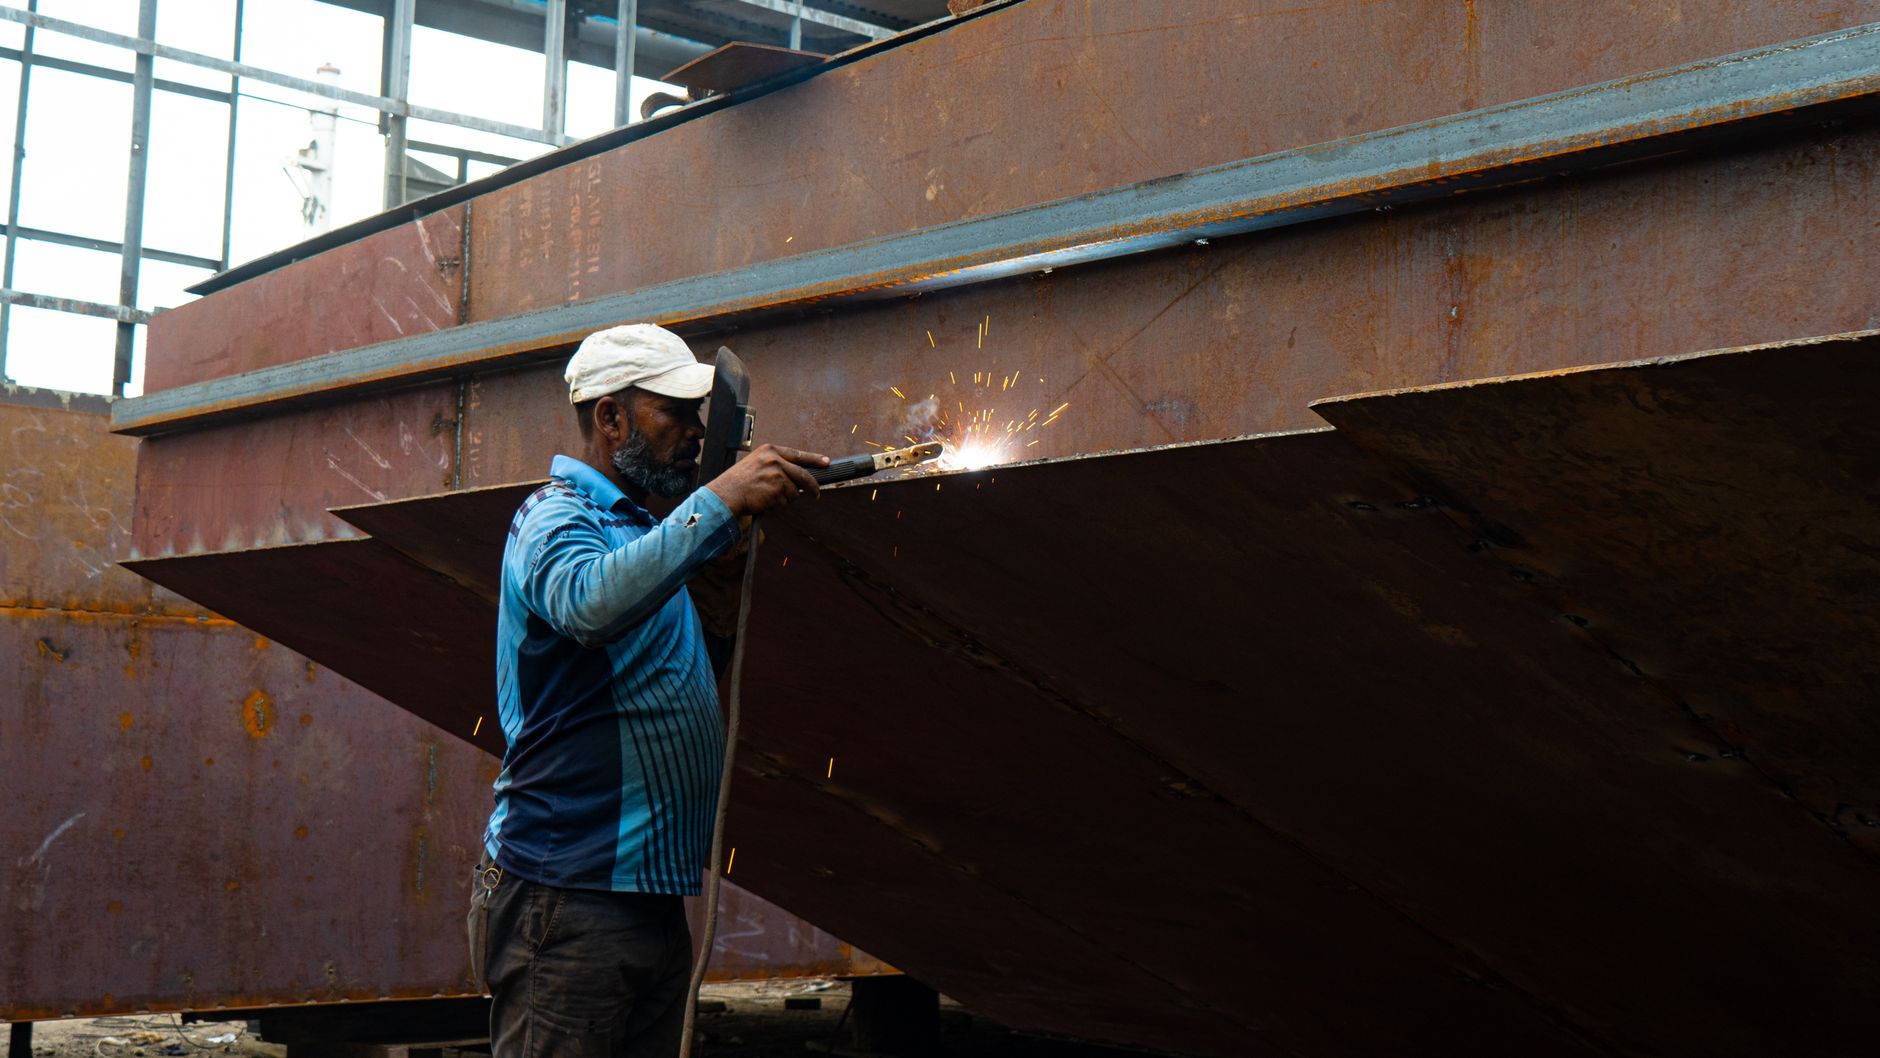
Shipyard labor is hard to hold. Navy testimony reported in March 2025 put shipbuilding attrition around 50 percent, with first-year attrition of 50 to 60 percent, which the official attributed mainly to pay. A naval news report from April 2025 gave a lower average of 20 to 22 percent for shipyard workers, and 30 percent or more in some critical trades. We could not confirm which official provided that second figure, and the two figures use different measures, so do not average them.
These rates describe the whole yard workforce, not material movers alone. Still, a yard that loses a large share of new hires in the first year has to retrain constantly. A robot that takes the repetitive hauling lets experienced crews stay on trades that take years to build. One large yard operator declined to publish its own attrition rates and called new-hire attrition very, very high.
What are the risks to the return, and how do you avoid them?
Positioning is the first risk. Accuracy on large structures is technically difficult, so route stops and docking points have to be surveyed, not estimated. A yard floor also changes as blocks move and temporary supports go in. Maps that fall behind reduce the hours a robot can take, so plan a re-mapping cadence and a way to update routes when the layout changes.
Crane conflicts are the second risk. Lift schedules shift, and a robot in a crane's path stops work. Agree exclusion zones with the crane team early, and build the route around lift windows instead of making the crane wait on the robot.
The third risk is scope creep. Loads that need rigging, hand alignment or inspection stay with people, and a plan that tries to automate them will underperform. Keep the robot on the repeatable runs and leave judgment work with the crew. That keeps the savings range honest.
- Repeated loops on a fixed route
Autonomous Mobile Robot
Strong. Same path every run, on schedule.
Staff
Works, but fatigue and shift length limit consistency.
- Overnight and off-shift runs
Autonomous Mobile Robot
Covers hours when no crew is on the floor.
Staff
Needs a shift premium and supervision.
- Heavy rigging and lifting
Autonomous Mobile Robot
Limited to the load and cart ratings. Not a rigging substitute.
Staff
Strong. Crews rig and lift with judgment.
- Nonstandard or damaged loads
Autonomous Mobile Robot
Stops and flags the load. A person decides what happens next.
Staff
Strong. Can adjust and make the call on the spot.
- Adapting to a changed layout
Autonomous Mobile Robot
Needs re-mapping before it runs the new route.
Staff
Strong. Adapts as soon as the layout changes.
- Crane and overhead coordination
Autonomous Mobile Robot
Must follow exclusion zones agreed with the crane team.
Staff
Strong. Reads the lift and adjusts.
What is a realistic timeline from assessment to payback?
The path runs in phases. First comes the site assessment and route survey. Next is mapping and integration, then a single-route pilot with one unit, and then a wider rollout once the pilot hours are measured. Payback is judged against the pilot's measured hours, not the planned ones, which is why the pilot phase exists. We do not give a fixed number of weeks on this page, because mapping effort and yard layout vary by site.
Shipyard use of this kind of automation is still early. A September 2025 agreement between a Korean shipyard group and robotics partners covers humanoid robots and mobile robots for shipyard logistics. The report describes it as a development partnership, not a confirmed deployment, so this page does not count it as evidence of return.
How do you get a precise figure from a free site assessment?
A free site assessment replaces the calculator's assumptions with your numbers. We walk the routes, time a sample of runs, count loads by type, record crane windows and shift patterns, and check floor condition and door widths. From that we choose the robot that fits the floor and the loads, and survey the route it will run.
Bring the data you already keep: move logs if you have them, the crane schedule, shift rosters, and a list of which bays feed which. We deploy and integrate the unit, train your staff, and service it nationwide. The lease payment is quoted after the assessment, through financing, so the figure reflects your site. Our ROI calculator on this page is the starting point. The assessment is what makes the range defensible.
Frequently asked questions
Want a warehouse robot at your shipyard?
Tell us about your site. We will recommend the robot, quote the lease, and keep it serviced.
Sources
- US Bureau of Labor Statistics, Occupational Employment and Wage Statistics (OEWS May 2024)
- MARAD 2013 economic study of US shipbuilding
- MARAD 2015 economic study of US shipbuilding
- Danish university study on plate storage crane scheduling, 2003
- Defense trade press report on Navy shipbuilder attrition, March 2025
- Naval news report on shipyard worker attrition, April 2025
- Maritime industry news report on shipyard robotics partnership, 2025