
The short answer
An autonomous mobile robot ROI for chemical plants comes mainly from taking repeat drum, tote and parts moves off the hours that laborers and freight, stock, and material movers, hand work takes, so process staff stay on process work. The return is a savings range built from the hours offset, the share of that work a robot realistically takes, and the lease cost, and the range is confirmed only after a free site assessment. Predictable routes and mapped floors push the range up, while irregular loads and unmapped areas push it down.
See what a autonomous mobile robot costsRun the numbers in the ROI calculator
Key takeaways
- The return comes from moving drums, totes and parts on fixed routes, not from replacing process operators.
- Savings are priced on the hours of material movement the robot takes over, valued at the local wage shown on this page.
- The share of work a robot realistically takes matters more than the number of routes on paper.
- Route predictability, load types and floor access move the number most.
- Payback is measured from logged results after go-live, and the lease quote follows a free site assessment.
Run the numbers for your site
Pick your city or state for a real regional number - we use the real BLS wage there. (On the live site this auto-detects from your location.)
What do you want to automate?
The robot takes the repetitive cart and pallet moves off the heaviest motion.
What return can chemical plants expect from autonomous mobile robot ROI?
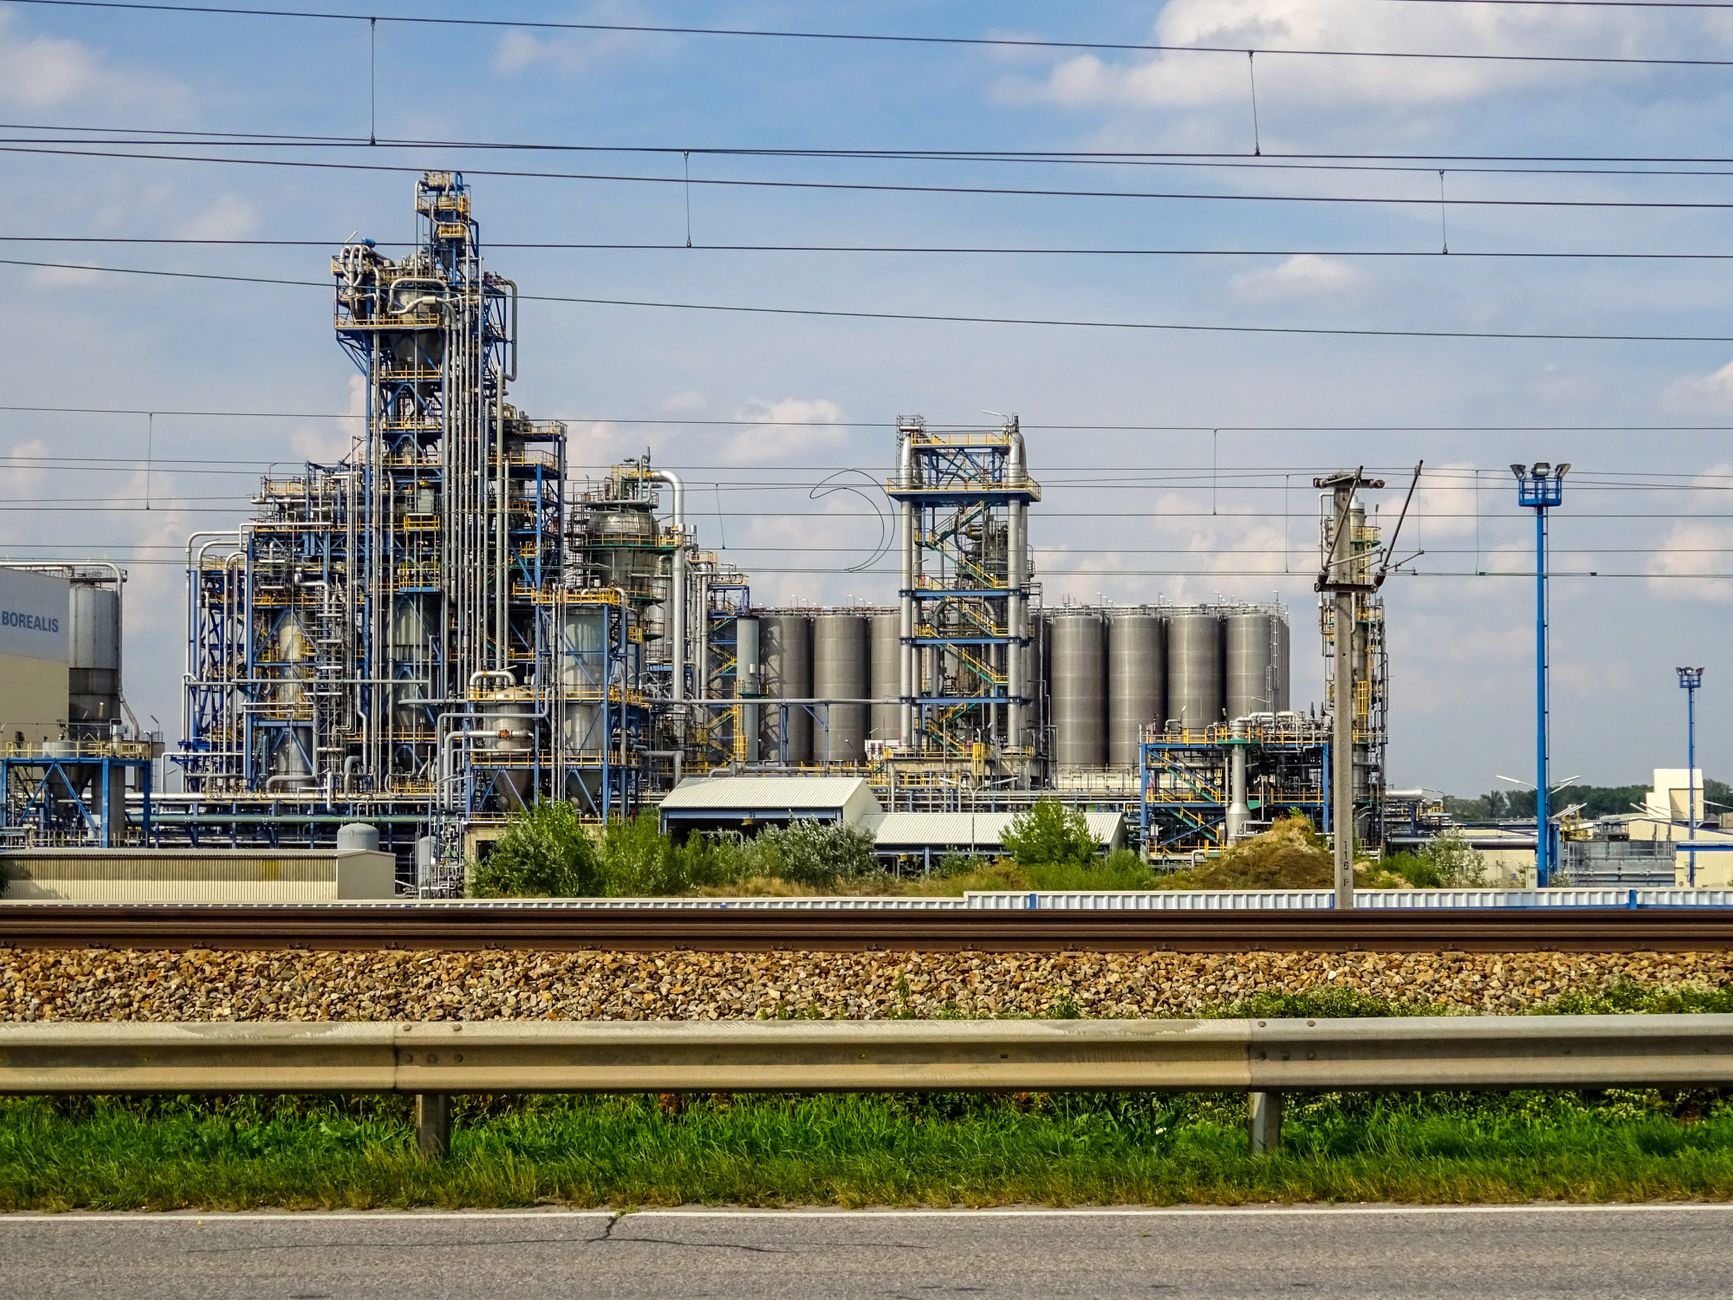
Chemical manufacturing is a large sector spread across the United States. The US Census Bureau counted 14,961 chemical manufacturing establishments in its 2022 Economic Census, up 10.2% from 13,571 in 2017, as reported by Australian Manufacturing. Plants in this sector tend to share a basic flow: raw materials arrive in drums, totes and bulk containers, move through process areas, and leave as product or waste, while spare parts and tools travel between areas all day.
The return from autonomous mobile robots in this setting is a labor return. It shows up as hours that laborers and freight, stock, and material movers, hand type work no longer takes from people, and as fewer interruptions for process staff who would otherwise leave their station to fetch a drum or a part. It does not come from cutting process operators, and a sound plan keeps them on the process.
Adoption context is useful but limited. According to A3, industrial robot orders in North America reached 36,766 units in 2025, up 6.6% from 31,311 in 2024, and collaborative robots made up 19.6% of units ordered. A3 figures exclude mobile robots, according to its EVP Alex Shikany in a February 2026 interview with Design News, so those totals do not measure how many plants run autonomous mobile robots.
Where does the return come from inside a chemical plant?
Most of the return comes from fixed-route material moves. Drums and totes come off receiving and go to storage or to a process area. Empties and returned containers go back out. Spare parts and tools move from the parts store to maintenance and back. Each of these moves follows a path that repeats, which is why a robot running on a schedule can take it over.
The people who do this work are usually counted under the laborers and freight, stock, and material movers, hand job, and the local wage for that job appears in the government wage data panel on this page. Plants also employ many process operators. The Bureau of Labor Statistics counted about 116,700 chemical equipment operators and tenders and about 61,600 packaging and filling machine operators in the chemical manufacturing industry in 2024, according to its industry page. Those roles run the process, not the moving job, so the robot should not be planned as a replacement for them.
Staffing churn adds context. A 2016 survey by a consulting firm and the American Chemistry Council, drawing on more than 500 chemicals industry respondents, found that most employers reported 30 to 50% attrition among millennial workers, and that more than 20% of the workforce was approaching retirement within 3 to 5 years. The survey is dated, so read it as background on turnover pressure rather than as a current rate. Repeat moves that depend on one experienced person are the first place that pressure shows up.
Median hourly wage, Laborers and Freight, Stock, and Material Movers, Hand
$4,380
Monthly cost of one full-time worker, at the median wage plus payroll costs (an estimate, not a quote).
How does the savings math work?
The calculation starts with hours. Take the hours per shift that people spend on drum, tote and parts moves, then multiply by the share of those hours a robot realistically takes over. Price those hours at the local wage for the material movers job, using the government wage data on this page. That gives the labor side of the savings range.
Subtract the lease cost, which is a fixed robot lease payment set through financing, and what remains is the net return range. We lease robots through financing and quote the lease payment after a free site assessment, so the range on this page is computed before any quote exists. Savings are always ranges. A range shows the spread between a conservative share of hours taken and a fuller share, and it does not promise a result.
Use the same structure when you compare options. A lower lease cost helps only if the routes take the same hours. A broader lease that covers more routes helps only if the logs show that the extra moves exist. Treat the planning count of six people doing material movement per shift as a placeholder, not a sourced figure. No verified national count of these roles per plant was available, so your site assessment replaces it with your own headcount.

What changes the number up or down?
Three things move the number most: how predictable the routes are, how varied the loads are, and how much of the floor a robot can safely use. A plant with a fixed loop and standard drum and tote sizes will land higher in the range than one with ad hoc moves across many rooms.
Shift pattern matters too. A robot can run scheduled moves through off-shift hours, which covers time that would otherwise need a person on call, but only when someone supervises the exceptions. Floor condition and access also count. Wet or grated surfaces, doorway widths and elevator access decide what a robot can reach, and that decides how much of the moving work it can take.
Which factors should you check before deciding?
The checklist below covers the factors that most often separate a strong range from a weak one. Each item can be checked from your own records before the site assessment, which makes the visit faster and the quote more accurate.
How much of the moving work can a robot realistically take?
A robot rarely takes all of the moving work. The realistic share is the set of moves that repeat, have a clear start and end, and fit the floor. Moves that need a hand on the load, a judgment call, or a special permit stay with people.
Partial takes are normal. A robot that takes the scheduled runs but not the hand-loaded ones still moves the largest block of hours. The share is set route by route, and the total is the sum of those routes.
Hour figures come from the site assessment, measured on your plant's own routes and shift records. We do not publish a national average for this task, because no verified source gave one. Use the table to see which tasks are candidates and which are not, not as a result.
- Repeat route on a schedule
Autonomous Mobile Robot
Runs the same loop the same way each time without breaks
Staff
Can do it, but fatigue and shift changes add variation
- Off-shift coverage
Autonomous Mobile Robot
Runs scheduled moves through quiet hours under supervision
Staff
Needs a scheduled shift and supervision on site
- Spill, leak or damaged container
Autonomous Mobile Robot
Stops and alerts staff, does not decide what to do
Staff
Sees it, judges it and acts with training
- Unusual or heavy loads
Autonomous Mobile Robot
Limited to the containers and weights its platform is set up for
Staff
Handles varied loads with lifting aids and judgment
- Route changes
Autonomous Mobile Robot
Needs remapping and retraining before a change goes live
Staff
Adjusts on the spot
- Hand-offs with process staff
Autonomous Mobile Robot
Follows its path and stops for people
Staff
Talks through the job and handles the hand-off
Robot or person: how do the two compare on this work?
The robot wins on consistency. It runs the same route the same way on every shift and does not drift off schedule when the plant is busy. A person wins on judgment, and that matters in a chemical plant. Someone has to notice a leak, a damaged drum or a load that looks wrong, and decide what to do next.
Most plants end up with both. The robot takes the repeat moves, and the person keeps the exceptions and the process.
What does a robot shift look like in a chemical plant?
A typical robot shift starts with a check of charge levels, the route map and any open alerts. The robot then runs its scheduled moves: drums from receiving, tote returns from process areas, and parts runs to maintenance. Staff see the queue on a dashboard and can pull a unit off a route when needed.
Between runs, the robot returns to charge. At shift end, the record of completed moves and stops shows which runs worked and which need a change. That record is the data a plant uses to measure the return.
What are the risks to the return, and how do you avoid them?
The biggest risk is a route that looks busy on paper but runs few real moves. Avoid it by measuring the moves during the assessment and building the plan from logs, not from memory. A second risk is scope creep, where a robot is asked to carry loads or cover routes it was not set up for. Hold the scope to the mapped routes.
Other risks are integration delays with plant systems, floor conditions that limit access, and a lease term that does not match how long the routes will stay in place. Plan integration early, test access on the real floor, and match the lease term to the planning horizon for the process.
Injury risk belongs in the picture too. According to the Bureau of Labor Statistics as reported by Business Insurance, the private industry total recordable case incidence rate fell to 2.3 per 100 full-time equivalent workers in 2024, down from 2.4 in 2023. Keeping drum handling with trained staff and sending only standard containers on the robot route keeps the work inside clear limits.
What is a realistic timeline from assessment to payback?
The sequence runs in order: a free site assessment that measures the moves, route mapping on the real floor, a lease quote, deployment and integration, staff training, then go-live support. Each step has a defined output, and the payback calculation uses measured results from the first months after go-live, not the first estimate.
Many plants start with one leased unit on one route family and add units once the logs confirm the share of hours taken. A phased start keeps the process running while the team learns the system and the routes. Payback follows the savings range and the lease quote, so it is measured on the plant's own records, not promised in advance.
Expect the first weeks of logs to be the least clean. Routes settle, staff learn the alerts, and exceptions get sorted. The payback number should wait until those patterns are stable enough to read.
How do you get a precise figure from a free site assessment?
Send the route list, the container types, the shift pattern and a rough count of moves per shift. We walk the floor, map the routes, time the moves and set the share of work a robot can take. The output is the savings range for your plant and a lease quote based on that scope.
Bring the data that already exists: move logs, shift schedules, floor plans, door and elevator details, and any handling rules for drums and totes. The better the inputs, the narrower the range. A precise figure comes from measured hours on your plant, which is why the assessment is free and comes before any commitment.
The quote lists the units, the routes, the lease term, the training, the go-live support and the service terms, so the figure can be traced line by line.
Frequently asked questions
Upcoming manufacturing events
- Trade showBrats & RobotsNov 10, 2026Alliant Energy Center Exhibition Hall, Madison, WI
- Trade showMATE Farm & Ranch ShowFeb 11 to 13, 2027MetraPark, Billings, MT
- ExpoPFMA Expo 2027Feb 17 to 18, 2027Washington County Fair Park, West Bend, WI
- ExpoLouisville Facilities Maintenance ExpoApr 15, 2027Mellwood Art Center, Louisville, KY
Want a warehouse robot at your chemical plant?
Tell us about your site. We will recommend the robot, quote the lease, and keep it serviced.
Sources
- US Bureau of Labor Statistics, Occupational Employment and Wage Statistics (OEWS May 2024)
- US Census Bureau 2022 Economic Census, as reported by Australian Manufacturing
- Bureau of Labor Statistics Industries at a Glance, chemical manufacturing (NAICS 325)
- Business Insurance, coverage of BLS 2024 injury data
- A3, robot orders grow 6.6% in 2025
- Design News, North American robot orders surge 6.6% in 2025
- 2016 survey on chemicals industry turnover and retirement, reported by BusinessWire