

The short answer
Autonomous mobile robot ROI for medical device manufacturers comes from labor hours moved off manual kit and bin runs between clean production cells, plus fewer handoff errors. The savings range depends on the share of those hours a robot can realistically take on a fixed route, the local wage for this job, and the lease cost quoted after a site assessment. The range becomes firm only when it is built from hours measured on your own floor.
See what a autonomous mobile robot costsRun the numbers in the ROI calculator
Key takeaways
- The return comes from kit and bin runs that move to a fixed route between cells.
- The savings figure is a range, set by the share of hours the robot takes over.
- Fewer handoff errors add value beyond labor hours, if you measure them.
- The lease cost is quoted after a free site assessment, not before.
- Measure the hours on your own floor before you commit to a route.
Run the numbers for your site
Pick your city or state for a real regional number - we use the real BLS wage there. (On the live site this auto-detects from your location.)
What do you want to automate?
The robot takes the repetitive cart and pallet moves off the heaviest motion.
What return can medical device manufacturers expect from an autonomous mobile robot?
The honest answer is a range, and the range depends on a few inputs you can measure. In most medical device plants, the first return comes from kit and bin movement between production cells, where a person pulls a kit from staging, walks it across the floor, waits at a cell door and signs for it. An autonomous mobile robot ROI for medical device manufacturers is built from three parts: the labor hours the robot takes over, the lease cost, and the value of fewer handoff errors.
The ROI calculator on this page is pre-filled for this industry, and it shows a computed savings range. Treat that range as an estimate, not a promise. It moves when the hours move, and each input below explains where the number comes from, so you can test the assumptions against your own floor before anyone signs.
How big is the medical device manufacturing base, and how common is automation?
According to the BLS employment series republished by FRED, California had 56.9 thousand workers in medical equipment and supplies manufacturing (NAICS 3391) in December 2025. The Minneapolis-St. Paul metro had 18.5 thousand and Massachusetts had 10.6 thousand. Those three figures show how concentrated this work is in a handful of states and metros, which matters when you plan route layouts and service coverage.
An aggregator reports 9,009 establishments, 7,997 firms and about 304,707 employees for NAICS 3391. That source does not state its year and is not an official Census count, so use it only as a rough order of magnitude and check the Census County Business Patterns table before you rely on it in a plan.
Automation is growing across US factories. According to the International Federation of Robotics, US industrial robot installations reached 38,000 units in 2025, up 11% year over year, in a preliminary release from June 2026. The same release puts US robot density at 307 units per 10,000 manufacturing workers, eighth globally. The IFR does not report a figure for medical device robot installations, so the sector comparison here is indirect.
Median hourly wage, Laborers and Freight, Stock, and Material Movers, Hand
$4,380
Monthly cost of one full-time worker, at the median wage plus payroll costs (an estimate, not a quote).
Where does the return actually come from in a medical device plant?
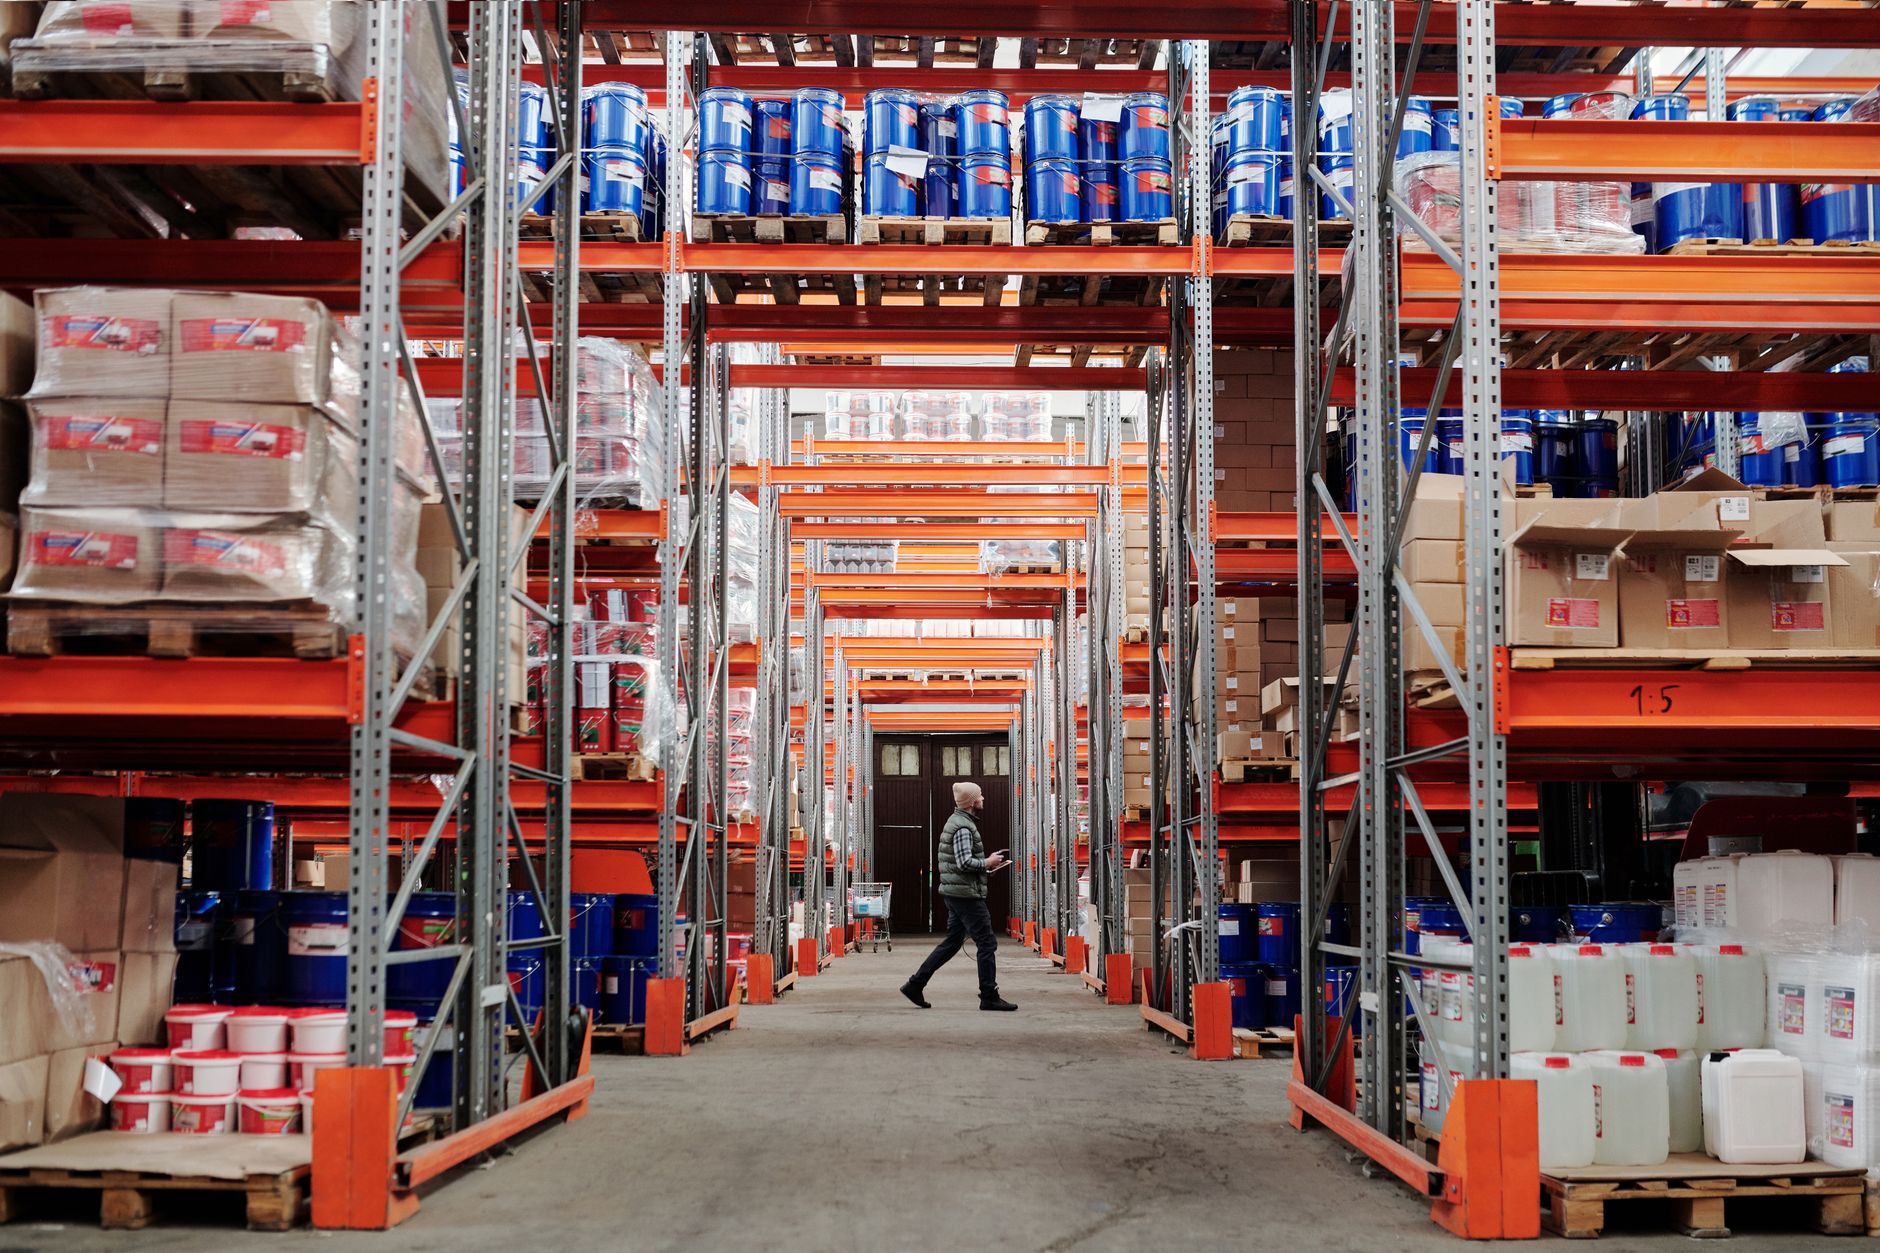
Most of the return sits in material movement that is repetitive, scheduled and easy to overlook. Parts kits, bins and sterile components move between clean production cells by cart or by hand. Each trip takes a few minutes, but the steps stack across shifts, and every handoff is a place where a wrong kit or a missed tag can start a rework. A fixed route removes the waiting and the guesswork, which is where most of the hours come from.
The work also belongs to a defined occupation. According to the BLS Occupational Outlook Handbook, about 2,988,900 jobs were held by Laborers and Freight, Stock, and Material Movers, Hand in 2024, within a broader hand laborers and material movers group of about 7.0 million jobs. The handbook projects 4 percent growth for that group from 2024 to 2034. The government wage data on this page covers the Laborers and Freight, Stock, and Material Movers, Hand occupation, and the savings math applies that wage to the hours the robot takes over.
Staffing is hard to hold steady. According to a secondary summary of BLS JOLTS data, the annual average job openings rate was 4.3% in 2025, down from 4.6% in 2024. That is a national openings rate, not a figure for medical device plants, but it is a reason not to assume a stable material handling crew when you model labor.
How does the ROI math work?
The model has three parts. First is the number of hours per shift or week that the robot can take over, measured on your floor. Second is the local wage for the Laborers and Freight, Stock, and Material Movers, Hand job, taken from the government wage data on this page and applied to those hours. Third is the lease cost, quoted after a site assessment and paid as a fixed lease payment over the lease term. The return is the labor value of the hours taken, set against the lease cost, plus any value from fewer handoff errors that you choose to count.
The most important term is the share of hours the robot realistically takes. Not every trip fits a fixed route. A robot handles repeated origins and destinations well and handles one-off moves poorly. So the model does not assume the robot takes every hour. It takes a share, and the savings range reflects a low and a high share, so you can see how much the answer depends on that choice.
Payback is the point where the cumulative labor value of the hours taken passes the cumulative lease cost, plus any setup and training costs that the quote includes. Because the lease cost and the hours both come from the assessment, the payback estimate is only as good as the hours measured on the floor.
Which hours does the robot take over, and which stay with people?
Think in tasks rather than job titles. The robot takes repetitive transport of parts kits, bins and empty totes between staging, production cells and the packaging or receiving area. People keep judgment work: checking a kit against a batch record, deciding whether a lot is held, handling a damaged tote, and clearing an obstruction in a controlled room.
The sources used for this page publish employment and adoption figures, not task hours for medical device plants, so the table below gives no industry hour numbers. It shows what to measure. During the site assessment, each movement task is logged with its frequency per shift and its handoff points, and those measurements feed the hours used in the model.

What risks could weaken the return, and how do you avoid them?
The main risk is an overstated share of hours. A plant that assumes the robot takes every cart run will see a shortfall as soon as exception moves stay with people. Set the share from measured data, and plan for the exceptions before counting them as savings.
The second risk is a route that causes a bottleneck. A robot that waits at a cell doorway can slow the line more than the manual cart did. Map every door and transition, test the interlocks, and keep a backup unit or a loaner in the plan so a single repair does not stop the route.
The third risk is staff bypassing the route. A route that operators do not trust gets worked around. Train the people on the floor, name an owner for exceptions, and review the measured hours with them after go-live.
- Overstated share of hours taken
- Doorway bottlenecks and unmapped transitions in controlled rooms
- Staff bypassing a route they do not trust
- Gaps in service coverage during repairs
How long does it take from assessment to payback?
The timeline has four stages: site assessment and mapping, the lease quote and financing, deployment and integration with staff training, and go-live support followed by a measured review. The assessment is free and produces the hours table, the route plan and the lease quote. Nothing in the lease is fixed before those measurements exist.
Payback is measured from go-live. Until the route runs on real traffic, the hours in the model are estimates, so plan a review after the first measured period and another when the route or the product mix changes. A phased rollout lets a plant start with one leased unit on one route and add units only where the measured hours support it, without shutting down the line.
- Consistency on fixed routes
Autonomous Mobile Robot
Same route and same stops every shift
Staff
Varies with the person and the hour
- Handling exceptions
Autonomous Mobile Robot
Stops and alerts when a path is blocked or a tag fails
Staff
Adapts, judges and fixes the problem on the spot
- Cleanroom access and gowning
Autonomous Mobile Robot
Needs mapped doors and tested interlocks
Staff
Already gowned and trained for the room
- Coverage across shifts
Autonomous Mobile Robot
Can run on shifts with thin staffing
Staff
Needs staffing for each shift
- Quality judgment
Autonomous Mobile Robot
Confirms scans and tags, not batch decisions
Staff
Makes batch and hold decisions
- Main cost driver
Autonomous Mobile Robot
Lease cost and the service plan
Staff
Wages, benefits and turnover
How do the lease, integration and service change the return?

We are a commercial robot integrator. We pick the robot for the site, lease it through financing, deploy and integrate it, train the staff and service it nationwide. For the return, the lease is the cash side, so the term and the included service matter as much as the lease cost. Ask for the quote to show exactly what service is included, how a repair is handled, and how spare coverage works.
Service affects the return directly, because every hour a robot is down is an hour a person may need to cover. Response time, remote triage and on-site dispatch belong in the model, along with a plan for emergency replacement. If your plant already runs more than one vendor's equipment, ask whether the integrator can manage it from one support point, since that changes who you call when a route stops.
How do I get a precise figure from a free site assessment?
The free site assessment replaces the range with your own numbers. We map the route, measure each movement task and its frequency, check cell doors and controlled-room transitions, and confirm the local wage for the job against the government wage data on this page. The output is a lease quote and a payback estimate built on your hours rather than on industry averages.
To prepare, gather shift schedules, a list of kit routes, the existing cell layout, the number of people who move material today, and any handoff error logs. Bring any overtime or staffing gaps, since they show where routed hours matter most. The more measured data you bring, the tighter the range becomes.
Frequently asked questions
Upcoming manufacturing events
- Trade showBrats & RobotsNov 10, 2026Alliant Energy Center Exhibition Hall, Madison, WI
- Trade showMATE Farm & Ranch ShowFeb 11 to 13, 2027MetraPark, Billings, MT
- ExpoPFMA Expo 2027Feb 17 to 18, 2027Washington County Fair Park, West Bend, WI
- ExpoLouisville Facilities Maintenance ExpoApr 15, 2027Mellwood Art Center, Louisville, KY
Want a warehouse robot at your medical device manufacturer?
Tell us about your site. We will recommend the robot, quote the lease, and keep it serviced.
Sources
- US Bureau of Labor Statistics, Occupational Employment and Wage Statistics (OEWS May 2024)
- BLS employment data for medical equipment and supplies manufacturing (NAICS 3391), via FRED
- International Federation of Robotics, US robot industry release
- BLS Occupational Outlook Handbook, Hand Laborers and Material Movers
- BLS JOLTS summary (secondary)
- Aggregator industry count for NAICS 3391 (third-party, year not stated)