
The short answer
Drone ROI for port terminals mostly comes from shorter crane and container yard inspections and fewer hours of crews working at height. Published case studies report one crane inspection falling from 3 working days to 2, and an operator write-up puts drone inspection about 70% faster than a manual inspector, though these figures are vendor and operator reported rather than independently audited. The savings range for your terminal depends on how many cranes and yard blocks you inspect and how much of that work the drone can realistically take, and the lease quote follows a free site assessment.
Key takeaways
- Crane and yard inspections show the clearest drone return because the work repeats on a fixed cycle and is slow by hand.
- Published case studies report inspection falling from about 3 working days to 2 per crane, with no scaffolding.
- The labor side of the savings range is priced on the hours of security guard type work the drone takes over, such as yard watch and patrol flights.
- The return shrinks when cameras lack resolution or when hands on checks still need a crew.
- A free site assessment turns these ranges into a lease quote for your own terminal.
Run the numbers for your site
Pick your city or state for a real regional number - we use the real BLS wage there. (On the live site this auto-detects from your location.)
What do you want to automate?
The unit runs the repetitive patrol and watch; guards handle the judgment calls.
What return can port terminals expect from drones?
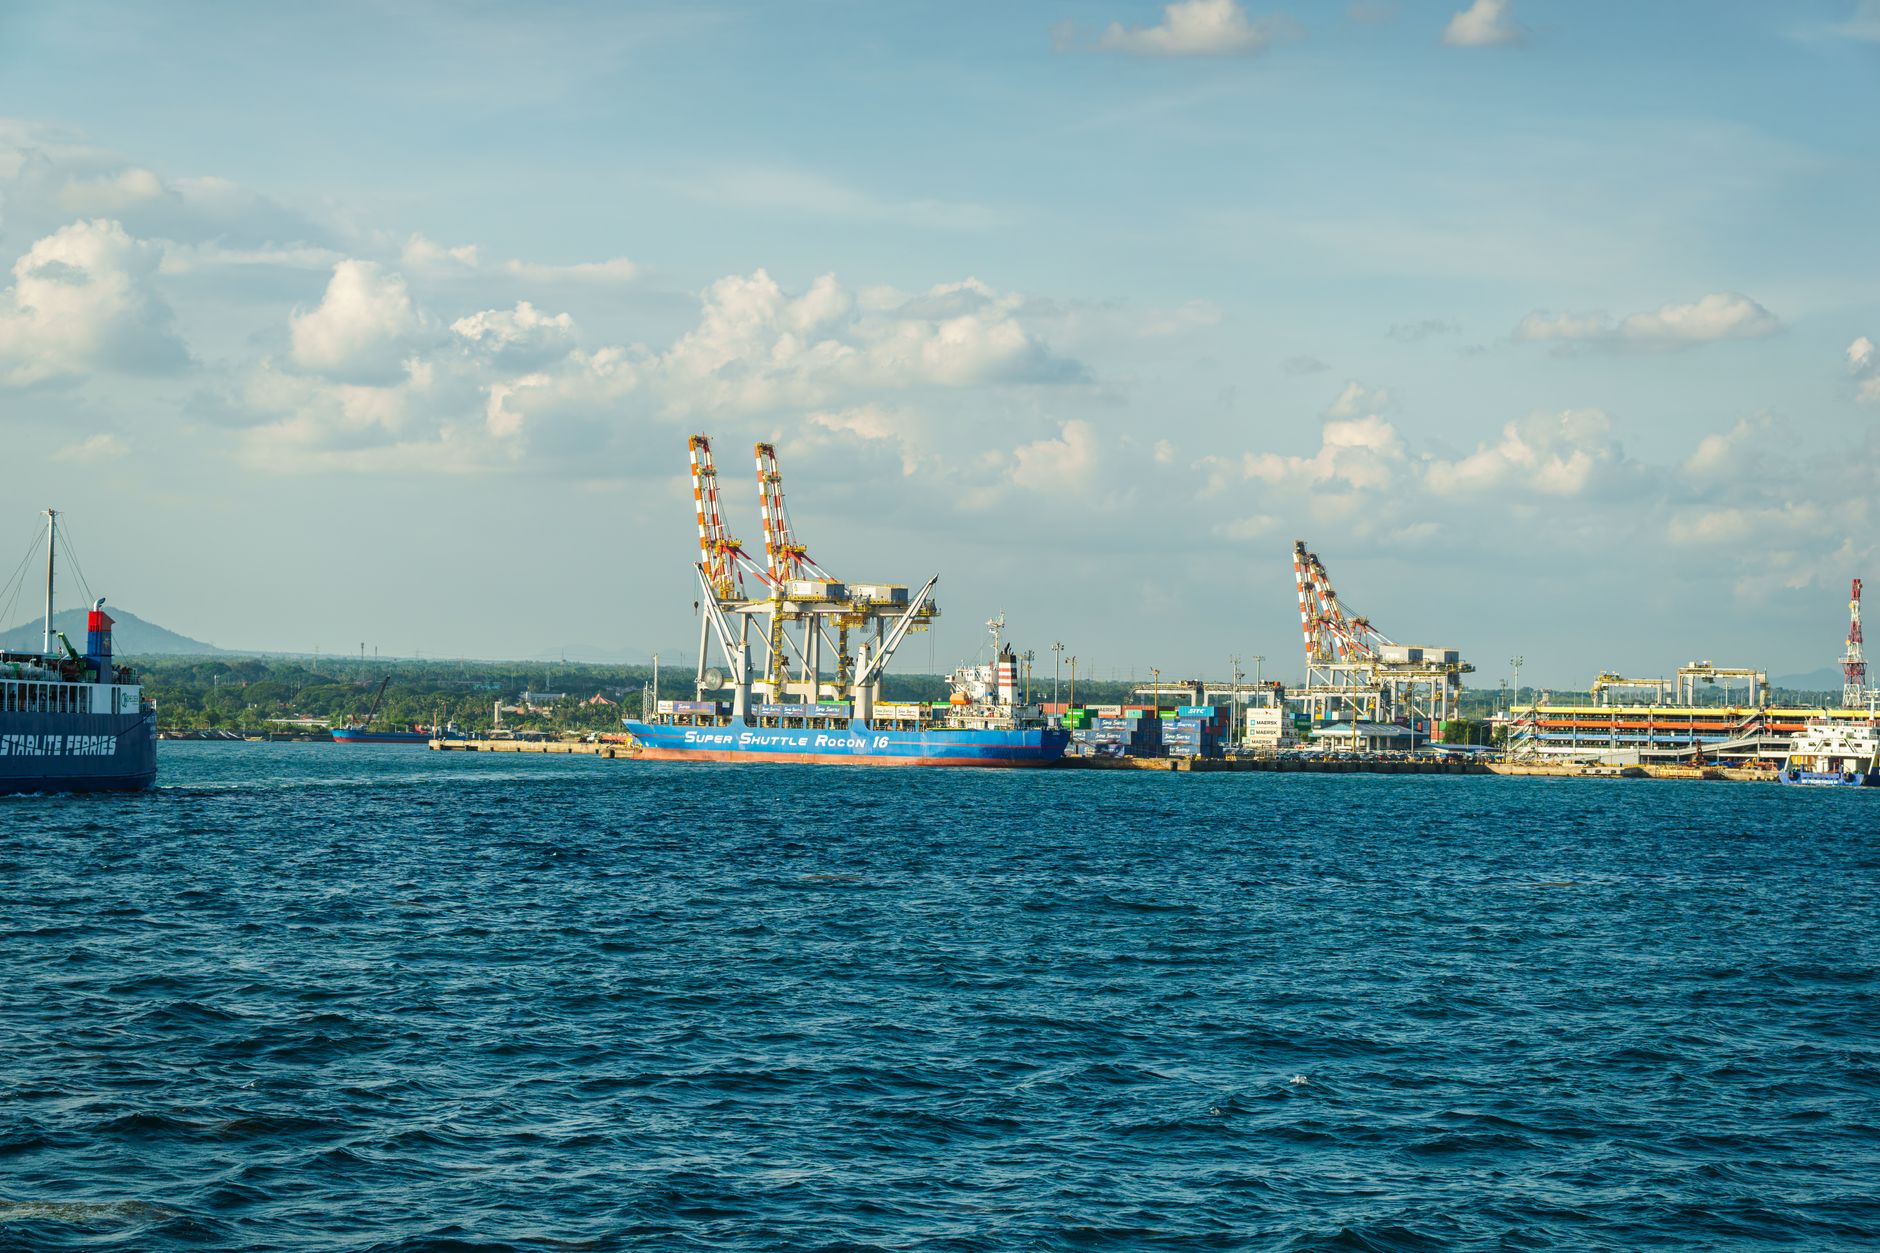
Port terminals can expect the clearest drone return from inspecting ship-to-shore cranes and container yards. Both are checked on a fixed cycle, both are slow to examine by hand, and both put crews at height or near moving plant. Drone ROI for port terminals therefore comes from two places: inspection time saved on each structure, and the hours of security guard type watch that a drone can take off the yard.
The inspection gains in published material are real but not independent. A case study from a Portuguese container terminal, produced by a certification body, reports 2 working days per crane against 3 by the manual method, with no scaffolding or extra equipment. An operator write-up in a trade publication puts drone inspection about 70% faster than a manual inspector. Read these as results from specific sites, not as a guarantee for your cranes.
Drone ROI for port terminals is worth testing first on the work that is repeatable and slow today. Start with one crane or one yard block, measure the hours, and decide on scale from those measurements.
Where does the return come from at a crane and container yard?
The return comes from four places: inspection passes that finish sooner, fewer hours of crew access at height, less scaffolding or rope work to set up, and yard watch hours that a drone covers from the air. The Portuguese case reported that inspectors also avoided work over water and at height. A New Zealand port's award entry, reported by the port itself, says the drone approach removes working at height and reduces person versus plant exposure.
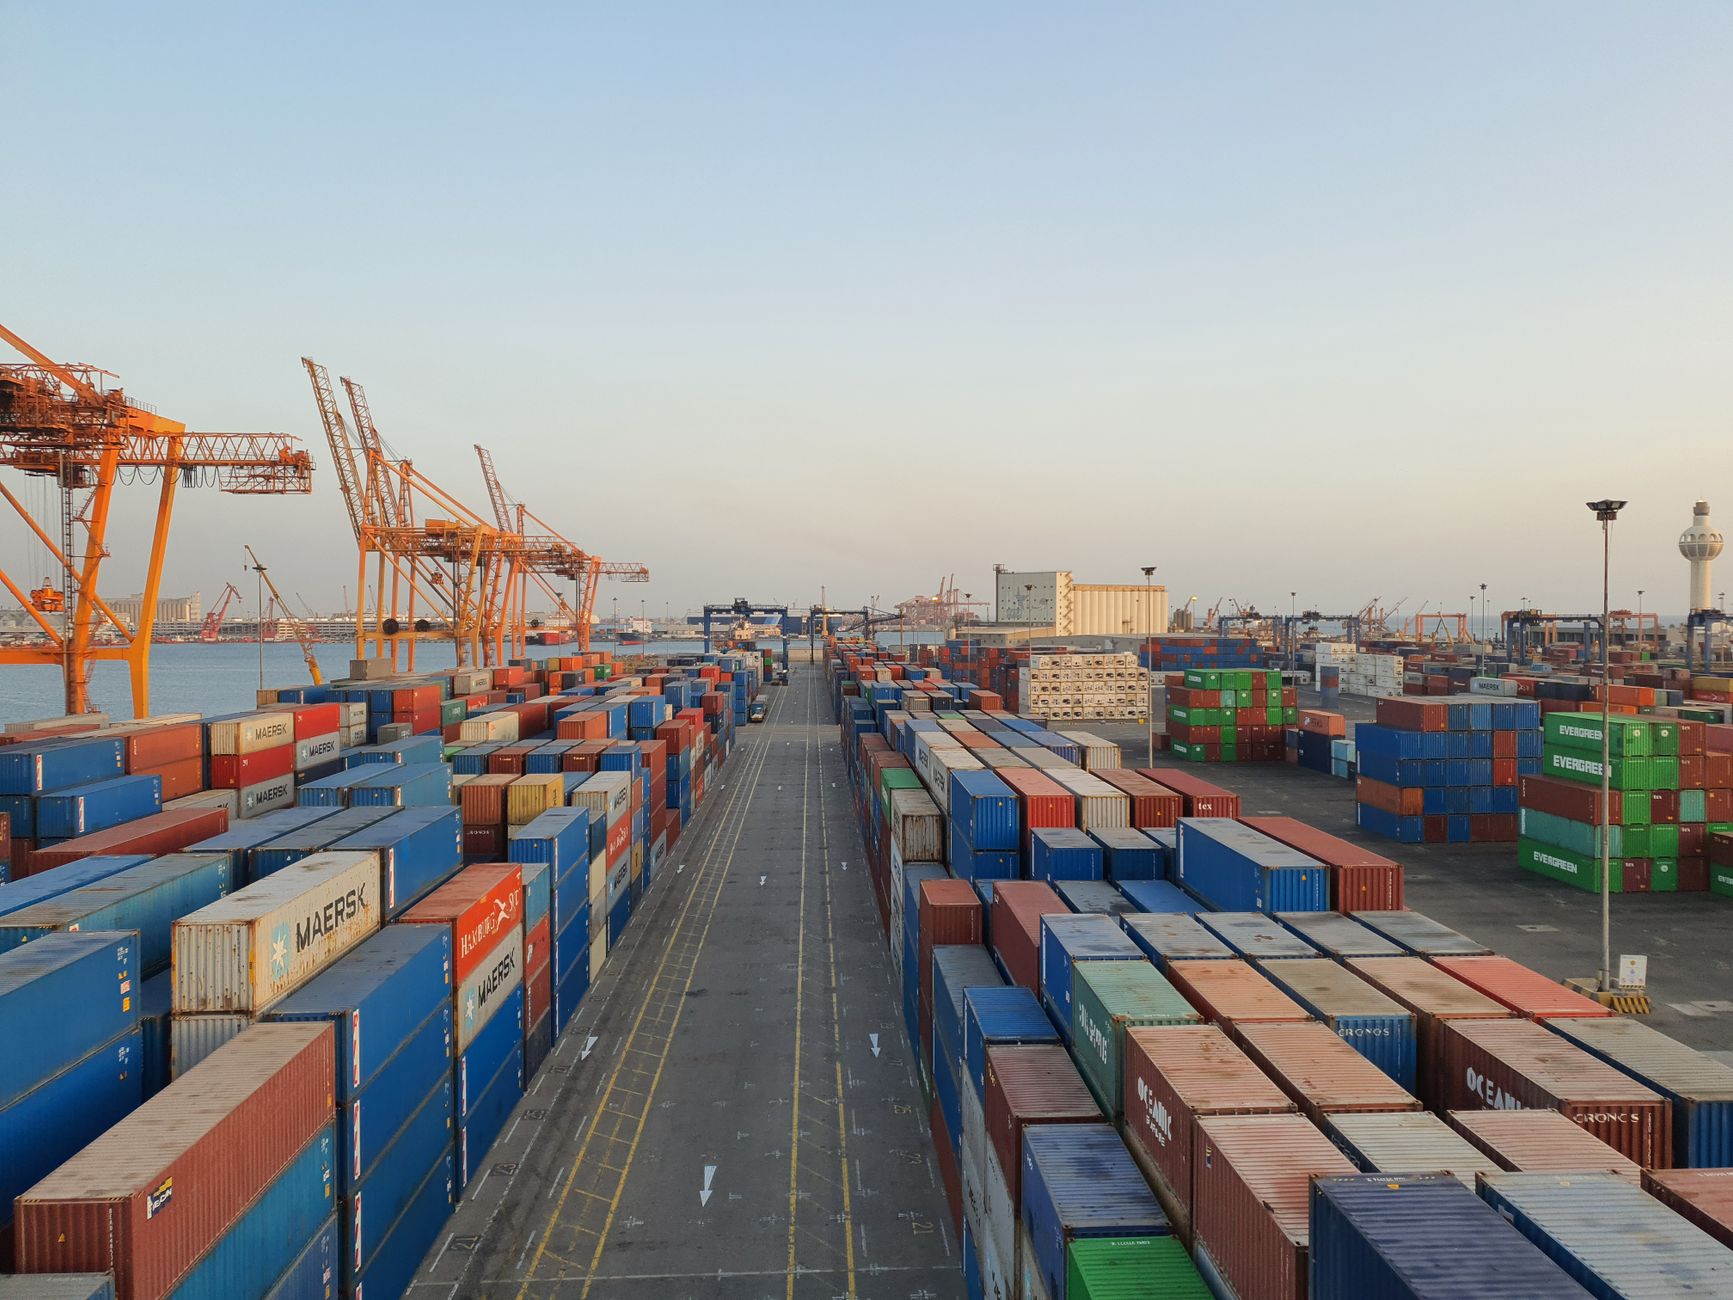
Yard work has its own volume. According to the container statistics page of a West Coast port, the port handled 4,119,868.50 TEUs for the calendar year to May 2026, up 1.39% from 2025. At that volume, yard blocks are full and survey windows are short, so a drone flying a fixed route between moves fits where a person walking the rows would have to stop work.
Scale also shapes the return. Each crane pass and each yard survey needs setup and clearance, so the more cranes and blocks a terminal inspects on each cycle, the more of that effort a drone can spread across the work.
Median hourly wage, Security Guards
$4,317
Monthly cost of one full-time worker, at the median wage plus payroll costs (an estimate, not a quote).
- Reaching crane booms and forestays
Drone
Flies to the member and images it, with no scaffolding or rope access needed
Staff
Needs scaffolding, a basket or rope access to reach the same point
- Judging a crack or weld defect
Drone
Records high resolution images for review, but only if the camera is sharp enough
Staff
Touches, measures and judges the defect on the spot
- Setup and staging
Drone
Launches from a clear pad on a planned route
Staff
Needs access permits, staging and equipment before the first check
- Wind, rain and night work
Drone
Grounded in high wind or heavy rain, and limited by lighting and flight approvals
Staff
Works through more weather under stop rules, but not in unsafe conditions
- Close check of container sides
Drone
Covers a yard block in one pass from above, but sides and low details can be missed
Staff
Walks the rows and sees the sides and low details the camera misses
How much height and injury risk does this work carry?
Keeping people off structures is the safety half of the case. According to the Bureau of Labor Statistics, transportation and warehousing recorded 865 fatalities in 2024, down 7.0% from 930 in 2023. Total US fatal work injuries in 2024 were 5,070, down 4.0% from 5,283 in 2023, according to the same BLS article.
The BLS Spotlight on transportation and warehousing reports 4.8 nonfatal injury and illness cases per 100 full-time equivalent workers, using 2022 data for the whole sector. OSHA's longshoring and marine terminal fatal facts describe a 2015 case in which a worker fell about 18 feet off a container onto a ship's deck, and a 2023 struck by case involving a twist lock in Houston.
These are sector and case figures, not an injury rate for inspection crews at one terminal. What they show is where the exposure sits: falls from height and struck by hazards around cranes and containers. Cutting the time people spend on those surfaces is a sound reason for a drone pilot even before any savings math.
How does the drone ROI math work for a port terminal?
The math has four inputs. First, the hours of security guard type work the drone takes over, such as yard watch and patrol flights. Second, the local wage for this job, shown in the panel beside this text. Third, the share of those hours the drone can realistically do, which is rarely the whole block. Fourth, the lease cost. Savings equal the hours taken over, times the wage, times that share, less the lease cost, shown as a range.
Inspection time is a second line, and the calculator does not price it. If a crane pass falls from 3 working days to 2, the crew days saved are real, but they are an operations gain. Value them with your own crew and scheduling costs during the assessment, so the savings range is not inflated by a labor rate the calculator does not use.
Staffing context is thin. The one dated example in our research, a 1999 PMA Update, describes two crane operators at one terminal making 288 moves in a shift. It is not about inspectors and it is not recent, so we use two as the typical headcount for this kind of work at one site until your own roster says otherwise.
The lease is a fixed robot lease payment quoted after a site assessment. Our team picks the drone package for your site, deploys and integrates it, trains staff and services it nationwide, so the quote covers service as well as the equipment.
What inspection hours do published case studies report?
Published figures come from vendors, operators and ports, and none comes from a US terminal. The Portuguese case study, which is vendor reported, gives 2 working days per machine against 3 by the manual method. The operator write-up says drone inspection is about 70% faster than a manual inspector, where a manual inspection takes roughly 2.5 days. That write-up adds that early drone cameras lacked resolution until the team moved to higher resolution cameras.
The New Zealand port's award entry says surveying one container roof, including setup, could take up to 5 minutes by the older method. A figure that small per container means the yard gain comes from covering many containers in one route, not from any single fast survey.
Use these as starting hypotheses for your pilot, not as inputs to the quote. The hours your pilot measures replace them in the calculation.
| Task | Today | With a robot |
|---|---|---|
| Inspect one ship-to-shore crane | 3 working days by the manual method | 2 working days, with no scaffolding or extra equipment |
| Survey one container roof, including setup | Up to 5 minutes by the older method | Not reported in the source; measure it in the pilot |
| Full manual inspection of a structure | Roughly 2.5 days | About 70% faster, per the operator report |
| Yard watch and patrol hours | Set by your roster and entered in the calculator | The share the drone takes over, set from the pilot |
Hour figures come from a vendor reported case study, an operator reported trade write-up and a port reported award entry. None is independently audited, and none comes from a US terminal.
What changes the return up or down?
Scale is the largest swing factor. Setup and access effort is shared across each pass, so more cranes, more yard blocks and more frequent cycles raise the return. Camera resolution comes next, since image quality decides whether the drone can take the survey share at all.
The share of the work that is survey rather than hands on test sets the ceiling. Load tests, close examination of welds and sign off on defects stay with qualified people, so only the survey share goes to the drone. The more of the scope that is survey, the larger the return.
Weather, light and airspace limits cut usable flight days, and each lost day pushes the cycle out. Flight rules and approvals depend on location and operating area, so the site assessment maps those limits before the lease quote is written.
What are the risks to the return, and how do you avoid them?
The main risk is overcounting. If the calculator assumes the drone covers all the work, the range looks wider than the site will deliver. Set the share from the pilot's measured results, not from a vendor report, and keep the low end of the range as the planning case.
The second risk is a drone that sits idle. Weather, a damaged unit or no qualified operator on the day can stop a cycle. Service with on-site dispatch, remote triage and spare unit coverage keeps the schedule, and a backup unit matters when a crane has a hard return to service date.
The third risk is inspection data that nobody acts on. Images only lower risk if the findings reach your maintenance records. Name who reviews each flight's images, how defects are logged, and how they carry into the next work order before go live.
What is a realistic timeline from assessment to payback?
The sequence runs from site assessment and mapping, to a pilot on one crane or one yard block, to a review of image quality and measured hours, to go live with trained staff, and then to a payback check against the measured share. Each step has a clear output, and the lease quote comes out of the assessment rather than before it.
Payback is measured after go live, not promised before it. The pilot shows the real share of hours the drone takes over, and that share drives the whole savings range. Expect the first review to change some assumptions, and plan the payback check against those measured results rather than the opening estimate.
Keep the pilot scope small enough to finish cleanly. One crane with a full inspection cycle and one yard block with a full watch route will show more than a loose trial across the whole terminal.
How do you get a precise figure from a free site assessment?
A free site assessment replaces assumed numbers with your numbers. Bring the crane count and inspection cycle, the yard block layout, the inspection hours per pass today, and the access equipment used today, along with any past inspection records and the flight restrictions your terminal already follows.
The site walk then maps access routes, flight limits and the hours of security guard type watch you want the drone to cover. The team returns a fixed robot lease payment with service terms, integration plan and go live support. Staff training is included, and on-site dispatch and remote triage cover service, so the terminal works with one partner and one number.
Frequently asked questions
Want a drone at your port terminal?
Tell us about your site. We will recommend the robot, quote the lease, and keep it serviced.
Sources
- US Bureau of Labor Statistics, Occupational Employment and Wage Statistics (OEWS May 2024)
- Lloyd's Register Quality Assurance case study, Portuguese container terminal (vendor reported)
- Port Technology trade write-up (operator reported)
- TT Club award entry on container crane inspections (port reported)
- BLS The Economics Daily, fatal work injuries declined in 2024
- BLS Spotlight on transportation and warehousing employment
- OSHA Longshoring and Marine Terminals fatal facts
- West Coast port container statistics page
- PMA Update, 1999