

The short answer
Cobot ROI for sign shops comes from the repeat handling a collaborative robot takes off your people at the router, cutter and finishing bench, not from the cutting itself. The return is a range built from the hours the robot really covers, the local wage for this job from the government wage data on this page, and the lease payment quoted after a free site assessment. Weeding, design and color work stay with staff, so the savings are only as high as the share of repeat work in your job mix.
Key takeaways
- The return comes from repeat handling at routers, cutters and finishing stations, not from design or weeding.
- Savings are a range built from measured hours, the wage for this job and the lease payment.
- Repeat share and changeover frequency move the number more than anything else.
- Start with one cell on one repeat task, then measure hours before extending.
- A free site assessment turns the range into a quote for your shop.
Run the numbers for your site
Pick your city or state for a real regional number - we use the real BLS wage there. (On the live site this auto-detects from your location.)
What do you want to automate?
The cobot stacks the repetitive end-of-line pallets; your team handles changeover and QA.
Cobot ROI for sign shops: what the return looks like
Cobot ROI for sign shops is the labor a collaborative robot takes off your people, set against what it costs to lease and service the robot. In a sign shop that labor is repeat handling at the router, the cutter and the finishing bench: loading substrate, unloading parts, stacking them and moving them along. The return is real when that work is steady. It is small when every job is a one-off.
The sector is large but spread out. According to Business Reference Guide Online, there were 5,702 businesses under NAICS 339950 (Sign Manufacturing) in its January 2026 update, with 2.4% growth from 2021 to 2025 and 0.7% projected growth from 2026 to 2031. That page does not say whether its counts are establishments or businesses, so use it for scale, not for a precise total. IBISWorld reports 41,805 sign and banner shop businesses for 2025, up 5.4% from 2024, and describes the industry as highly fragmented, with no company holding more than a 5% share.
Shops tend to be small. The 2017 SGIA industry survey, covering nearly 200 companies, found a median of 12 employees. IBISWorld puts 2025 sector employment at 32,817, up 3.6% that year. The typical headcount on this page, 12, is total staff at a median shop, so the number on cutting and finishing is smaller, and that smaller number is what your assessment measures.
Fragmentation shapes the return. One cell can change how a whole bench runs, which makes a focused pilot sensible. A plan that depends on spreading a large fixed cost across a big payroll is unlikely to fit most shops in this sector.
Where does the return come from in a sign shop?
The return comes from hours of work that is repetitive, physical and paced by the machine. In practice that means tending a router or cutter table, loading sheet or substrate, pulling finished parts, stacking them and carrying them to the finishing station. That kind of work sits in the same family as Laborers and Freight, Stock, and Material Movers, Hand, and the savings on this page are priced on the local wage for that job, taken from the government wage data on this page.
Weeding needs a different read. Removing waste vinyl or masking is hand work that depends on touch and judgment, and a cobot does not take it over in most shops. The robot can tend the cutter that produces the parts and move them on while a person weeds. Count only the work the robot actually takes, or the number will run high.
Finishing is the second source. A cobot can move parts between a cutter, a cleaning or sanding station, a laminating table and a rack, provided the stations are fixed and the part sizes fall inside what the robot can handle. Inspection, color matching and hand fitting stay with people, and that work protects quality.
We work with shops on this exact layout. We pick the robot for the site, lease it through financing, deploy and integrate it, train the staff and service it nationwide. Our first step is mapping the stations and the material flow, so the return is counted on the work that really moves.
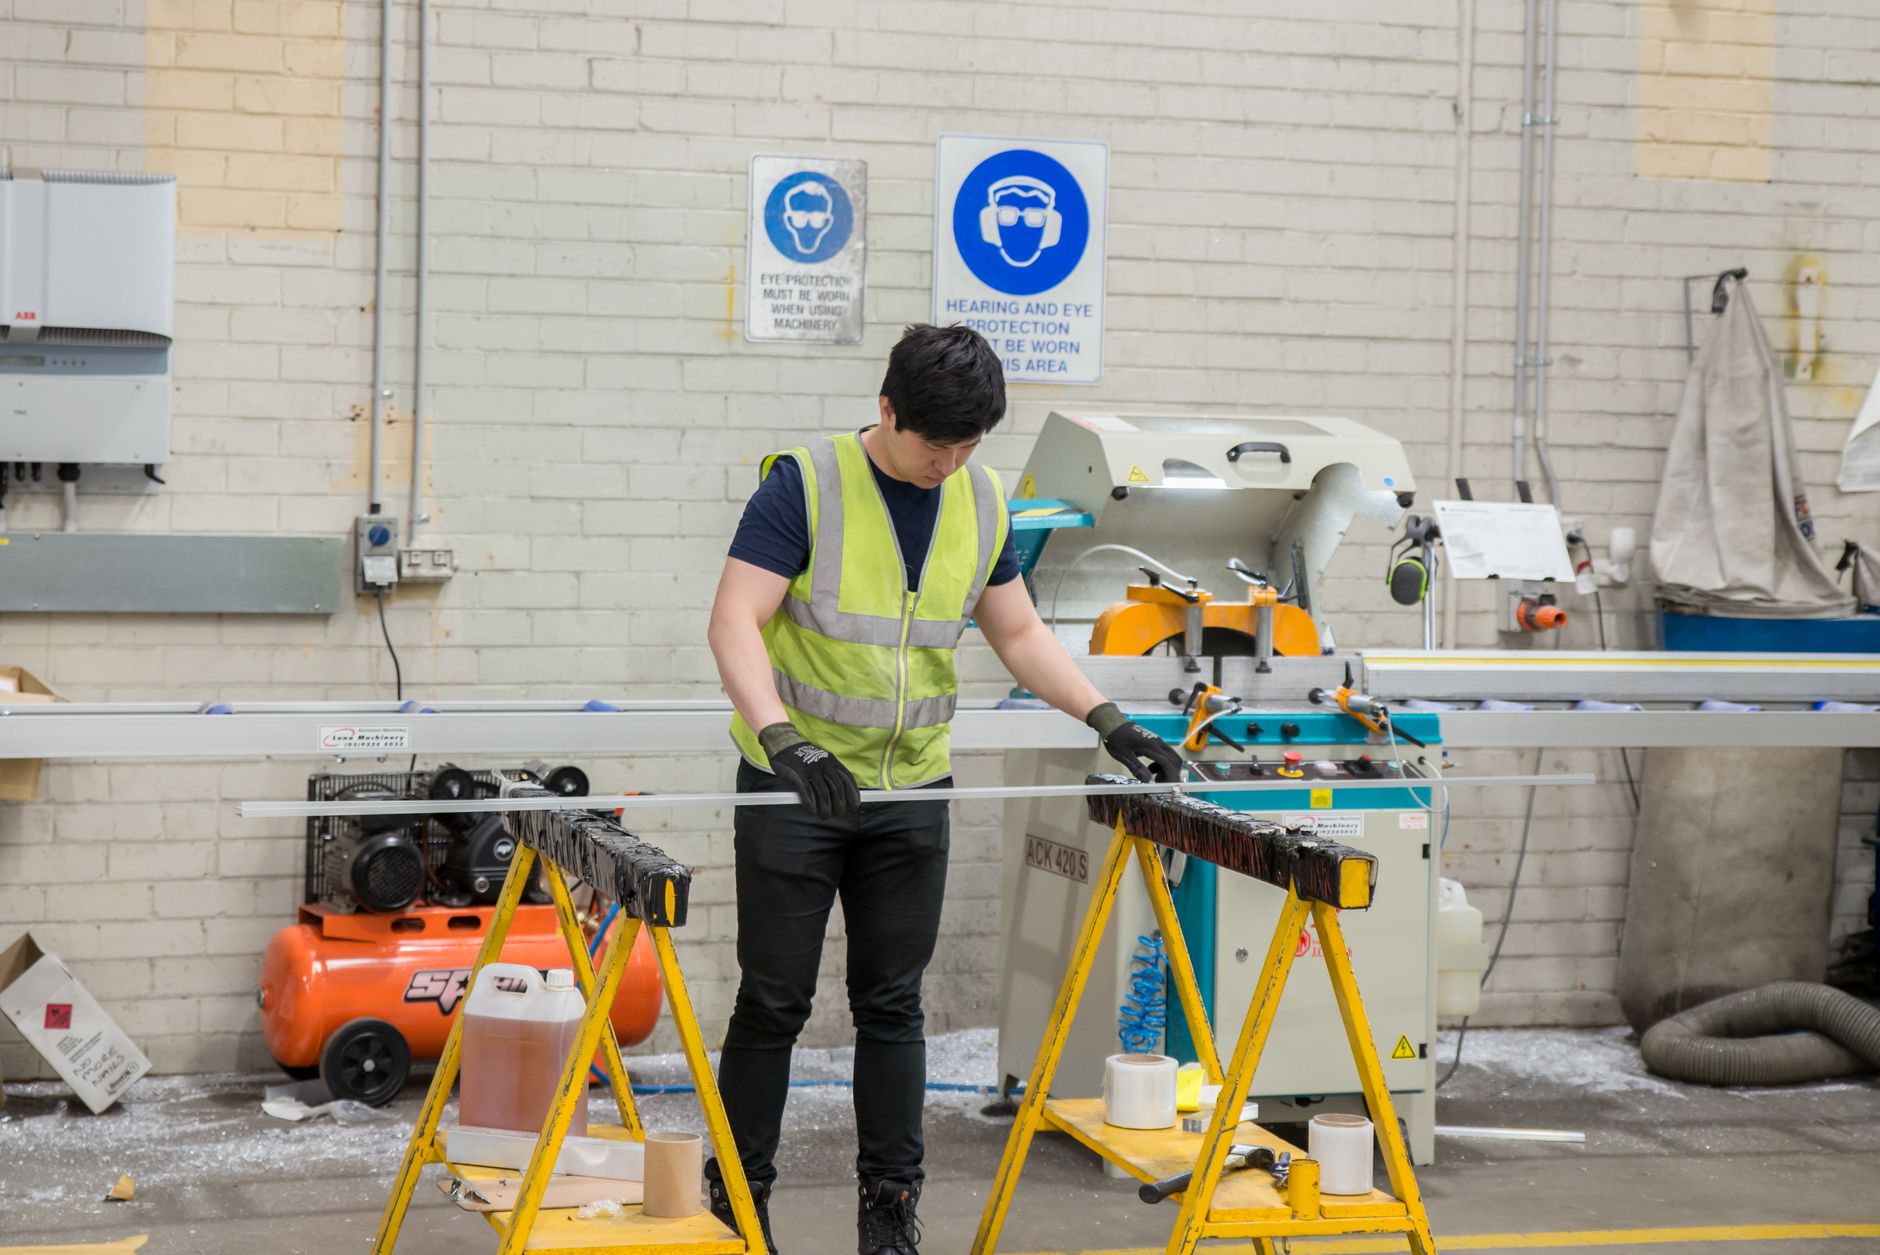
Median hourly wage, Laborers and Freight, Stock, and Material Movers, Hand
$4,380
Monthly cost of one full-time worker, at the median wage plus payroll costs (an estimate, not a quote).
How much of the work does a cobot really take?
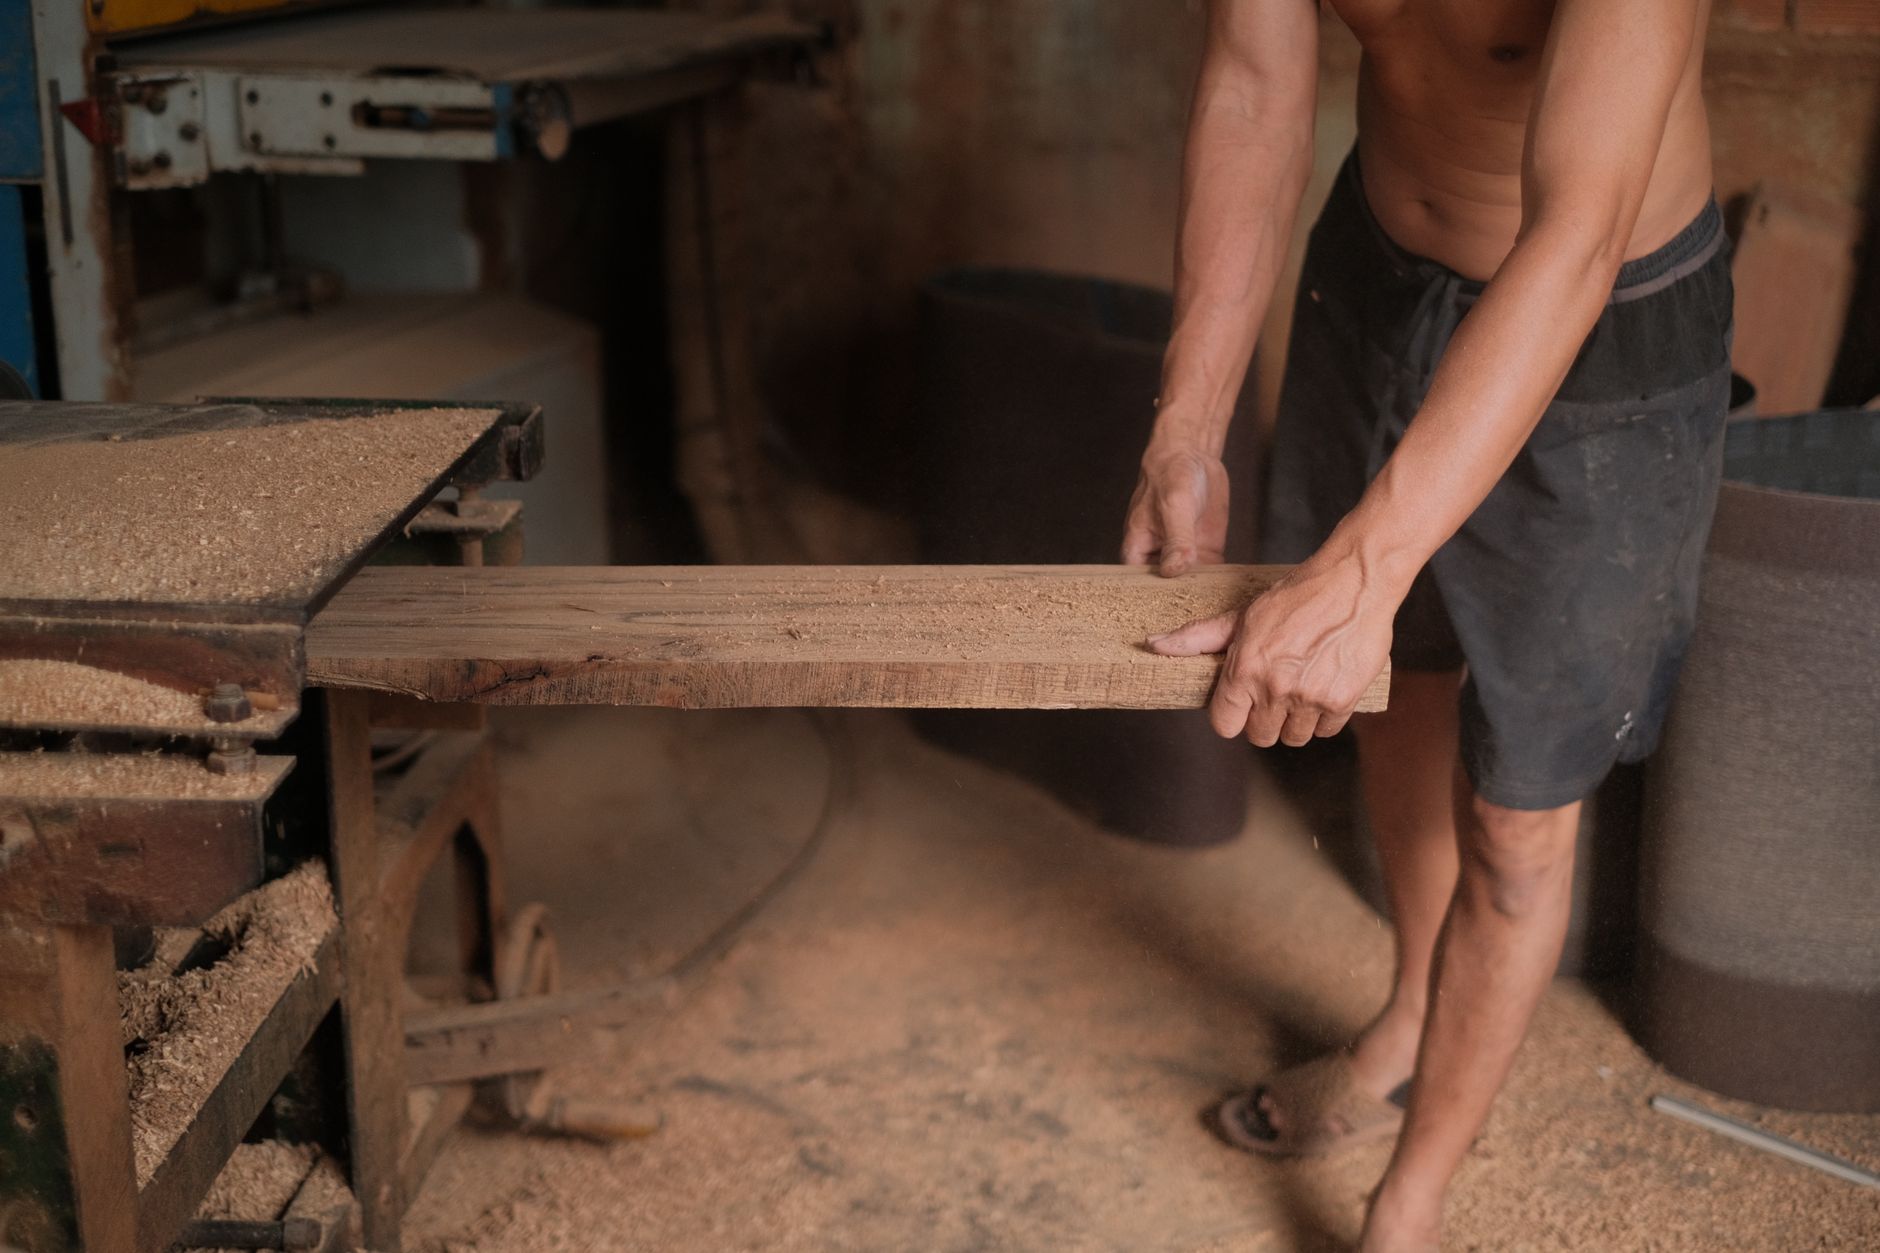
The return depends on the share of the work the robot takes, not on the share of the shop it touches. A cell that loads and unloads one router all day takes most of the tending at that router. It takes almost none of the design and setup, and it does not take weeding. Set the share per station, then add the stations, rather than assuming one percentage for the whole shop.
No verified hour figures for these tasks were found in this research pass, so this page does not put a number on hours per shift or per week. The hours to use are the ones in your own job log: time at each station each week, split between repeat handling and skilled work. If you have no records, ask staff to log two normal weeks before any estimate is made.
The table below lists the tasks by type. It shows where staff time goes now and what people still do with a robot in place.
How does the savings math work?
The math has three inputs. The first is the hours of repeat handling the robot takes each week. The second is the local wage for this job, from the government wage data on this page, which prices those hours. The third is the lease cost, quoted after a site assessment as a fixed robot lease payment through financing, with nationwide service in the same engagement.
Gross labor offset is hours taken multiplied by the wage. Net return subtracts the lease payment and any setup or training cost. Savings are shown as a range because hours taken and job mix both vary, and because a robot that waits for material or resets a fixture takes fewer real hours than a plan assumes.
Use this discipline when you check the number. Take the low end of the hours range, apply the share the robot can really cover at each station, and then compare the result to the lease payment. If the net is still positive, the cell deserves a closer look. If it only works at the top of the range, the job mix or the layout has to change first.

What changes the number up or down?
Repeat share is the biggest lever. Shops that run the same part many times in a row keep the robot busy. Shops that run many one-off jobs lose time to changeover, and that time comes straight out of the gain.
Station count and layout come next. A cell that reaches two stations usually returns more than one that needs a new fixture for every job. Part size and weight must fit what the robot can handle, and the path between stations has to stay clear of people and carts.
Staffing history matters too. If you have open repeat roles and trouble filling them, the robot covers that work while the role stays open. If the team is stable and trained, the robot is an efficiency choice rather than a staffing one, and the return is smaller but still measurable.
What are the risks to the return, and how do you avoid them?
The main risk is low utilization. A robot that waits for material, or for a person to reset a fixture, takes few real hours off the bench. Avoid it by planning the feed and clear steps, keeping material staged at the cell, and starting with the highest volume station.
The second risk is scope creep. Putting weeding, color work and rush jobs into the same cell raises cost and lowers the hours saved. Keep the cell to one repeat task, prove the hours in the log, then extend it to a second station.
Injury exposure is a reason many managers look at automation. According to the Bureau of Labor Statistics as summarized by J.J. Keller, private employers reported about 2.5 million nonfatal injuries and illnesses in 2024, down 3.1% from 2023. That figure covers private industry as a whole, not sign shops, and it comes from a secondary summary. Use it to frame the discussion, not to forecast your own incident rate.
How common are cobots in manufacturing and shops?
Cobots are no longer a niche tool. According to the International Federation of Robotics in its World Robotics 2026 president's report, cobot installations reached 66,000 units in 2025, or 11% of all industrial robot installations. Total installations passed 600,000, reaching 603,000, up 11%.
The share has moved gradually. The IFR 2024 press conference put cobots at 10% of 2023 installations. A move from about 10% to 11% over two years points to steady growth, although cobots remain a minority of all industrial robots.
For a sign shop, the question is fit more than novelty. The technology is proven in general, but sign work is a small corner of it. Ask any integrator to show work in small batch finishing or similar cells before you commit, and ask to see the cell running.
What is a realistic timeline from assessment to payback?
The timeline runs in stages. First, a site assessment maps the stations, the material flow and the job mix. Second, the cell design and lease quote follow. Third, deployment, integration and staff training happen on the floor. Fourth, a go live period measures hours against the baseline in your job log.
Payback is the point where accumulated net return covers the lease and setup costs over the lease term. We do not promise a date for it. The honest method is to use measured hours from the first weeks after go live to narrow the range, then compare that to the plan you approved.
The lease term also matters. A longer term usually lowers the periodic payment, but the robot still has to cover its cost in hours over that term. Check that the cell will still fit the work when the term ends, because a repeat task that disappears leaves a robot with nothing to tend.
How do I get a precise figure from a free site assessment?
A free site assessment turns the range into your number. We ask for the job log or a rough two weeks of station times, then walk the floor to measure reach, clearances, part sizes and feed points. We map the stations and flow, identify the repeat task, and check the result against the staff hours you already track.
We pick the robot for the site, lease it through financing, deploy and integrate it, train your staff and service it nationwide. The lease payment comes in a quote after the assessment, so you see a figure for your shop rather than a generic one. The assessment itself commits you to nothing.
Bring the job mix, the stations you want covered, the hours per station and the lease term you would consider. With those four inputs, the savings range narrows to a figure you can take to the person who signs off, and the layout question is answered before anything is ordered.
Frequently asked questions
Want a cobot at your sign shop?
Tell us about your site. We will recommend the robot, quote the lease, and keep it serviced.
Sources
- US Bureau of Labor Statistics, Occupational Employment and Wage Statistics (OEWS May 2024)
- Business Reference Guide Online, Sign Manufacturing
- IBISWorld, Sign and Banner Shops, Number of Businesses
- IBISWorld, Sign and Banner Shops Industry
- IBISWorld, Sign and Banner Shops, Employment
- SGIA 2017 Industry Survey Results
- J.J. Keller, Employee Injuries and Illnesses Down 3.1 Percent in 2024
- International Federation of Robotics, World Robotics 2026 President's Report
- International Federation of Robotics, World Robotics 2024 Press Conference