
The short answer
Cobot ROI for candy manufacturers comes from taking repetitive case packing and palletizing hours off the packaging line, especially on the night shift when that work is hardest to staff. The savings range is priced on the hours of laborers and freight, stock, and material movers, hand type of work the robot takes over, less the share it cannot handle and the lease payment quoted after a free site assessment. The range moves with pattern variety, changeover frequency and how well service is planned for seasonal peaks.
Key takeaways
- Case packing and palletizing hours are the main source of return, not the whole line.
- The savings range is priced on laborer type hours the robot takes over, not on total headcount.
- Pattern variety and changeovers move the number more than any other input.
- Candy sales are seasonal: according to NCA, four big seasons made up 63% of 2025 confectionery sales.
- The lease payment is quoted after a free site assessment that measures your real hours.
Run the numbers for your site
Pick your city or state for a real regional number - we use the real BLS wage there. (On the live site this auto-detects from your location.)
What do you want to automate?
The cobot stacks the repetitive end-of-line pallets; your team handles changeover and QA.
What is cobot ROI for candy manufacturers?
Cobot ROI for candy manufacturers comes from a narrow set of repetitive jobs at the end of the line: case packing, palletizing, and the material moving that feeds those stations. A collaborative robot arm does not run the candy line. It takes over the lifting and stacking that a crew does at packaging stations, often on the night shift, where staffing is thinnest and repetitive lifting strains people over long shifts.
The savings range on this page is priced on the hours of laborers and freight, stock, and material movers, hand type of work the robot takes over. The government wage data on this page supplies the local wage for that job. People still run changeovers, quality checks, and maintenance, and the range assumes they keep doing so.
According to BLS Economics Daily, published in March 2026, sugar and confectionery products manufacturing had 81,324 workers, including 27,602 in nonchocolate confectionery manufacturing. Packing work is one part of that total, and it is the part where a cobot can be measured.
How many people work in candy manufacturing?
According to the Bureau of Labor Statistics Occupational Employment and Wage Statistics, sugar and confectionery manufacturing employed 16,180 food batchmakers in May 2023, about 19.8% of that industry's workforce. Food batchmakers mix, cook, and form product upstream of packing, so they work close to the lines where cobots pick up the end-of-line work.
The case packing and palletizing hours that a cobot takes over are priced on the laborers and freight, stock, and material movers, hand type of work. Batchmakers and line leads are not priced into the range, because the robot does not take their work off their plate.
This page uses a typical count of about 12 people doing this packing work across all shifts at a single site. Your site assessment replaces that working figure with the real count from your own schedule.
Median hourly wage, Laborers and Freight, Stock, and Material Movers, Hand
$4,380
Monthly cost of one full-time worker, at the median wage plus payroll costs (an estimate, not a quote).
Where does the return come from on a candy packing line?
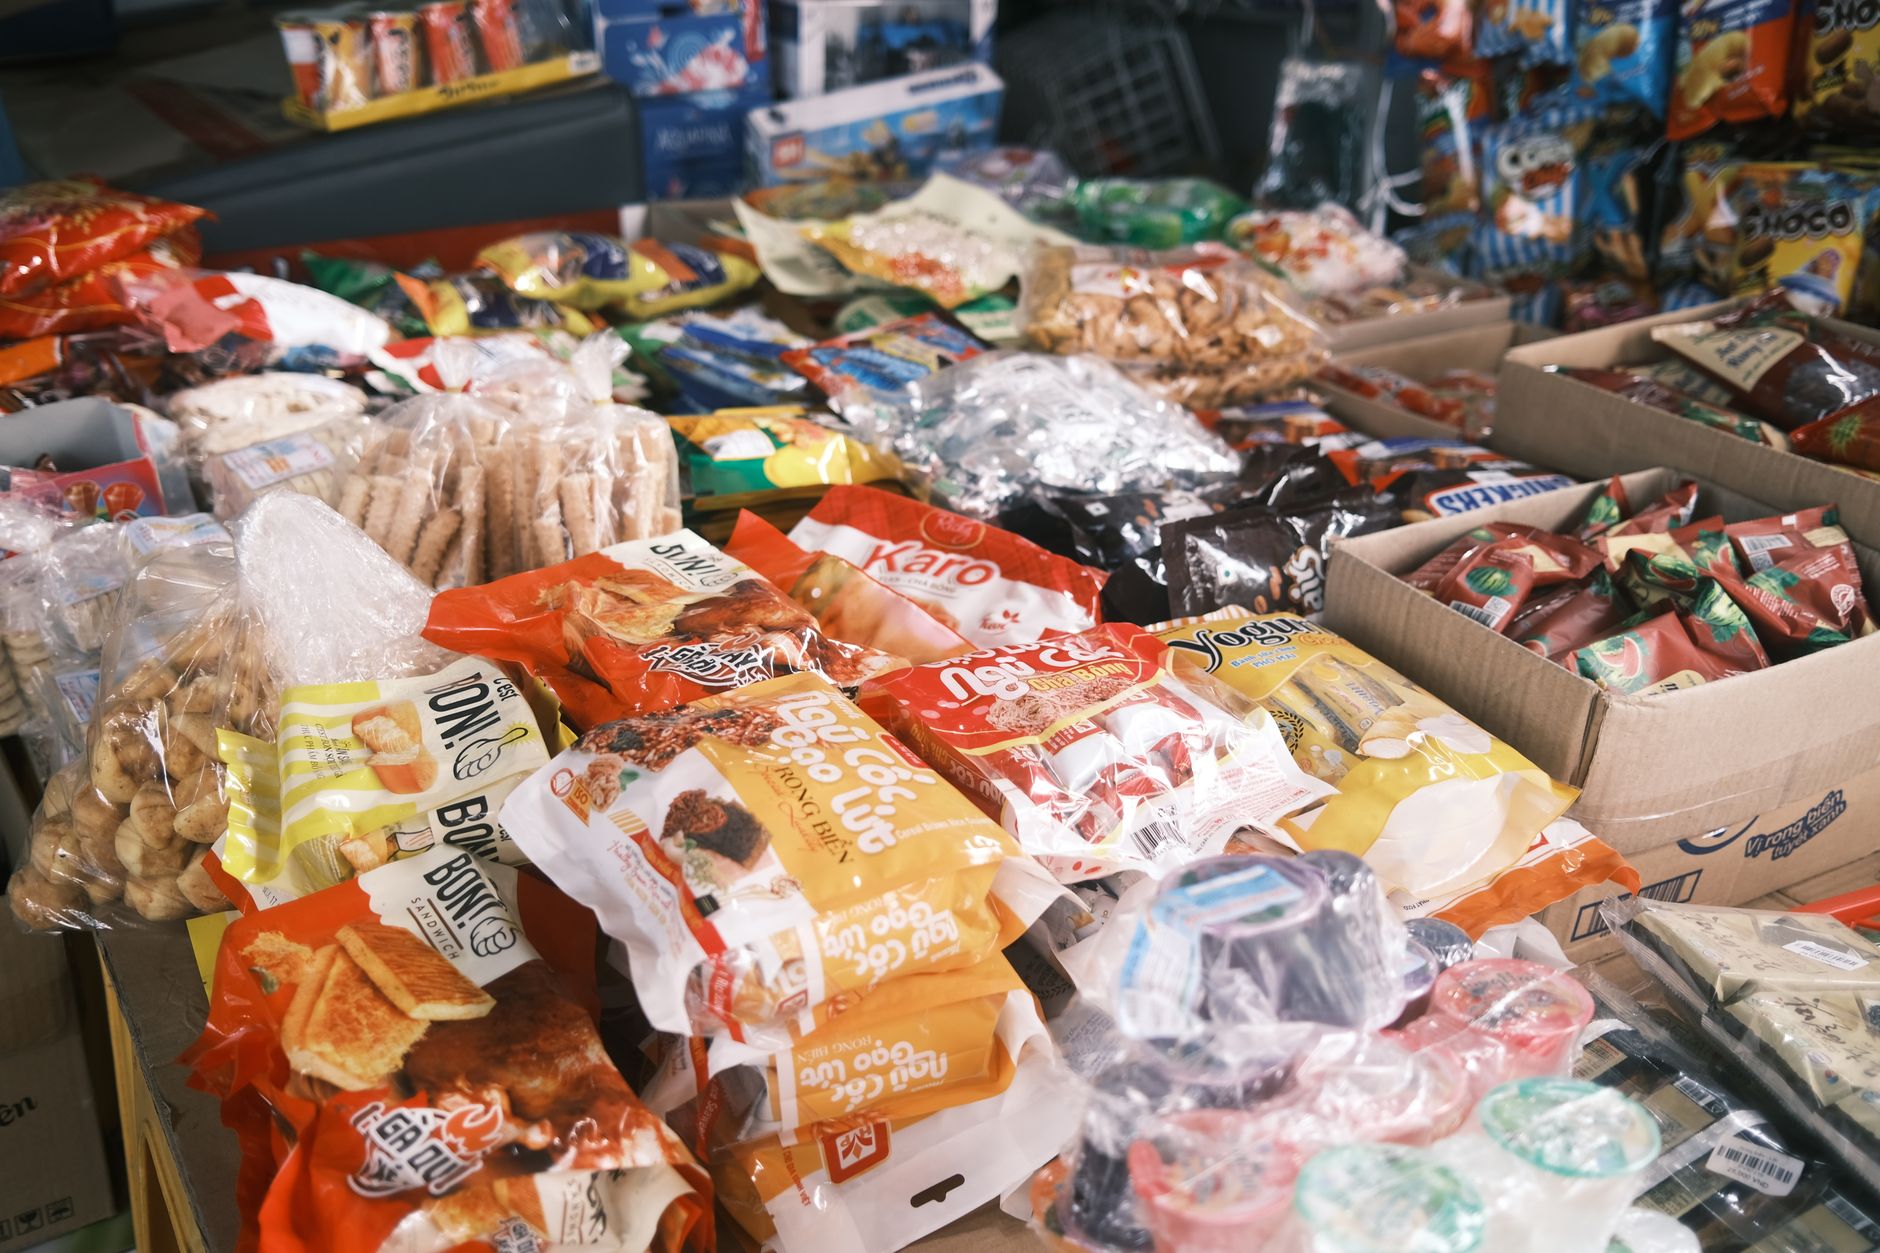
The return comes from the repetitive middle of the packing process. Cartons are filled and sealed, cases are formed, and finished cases are stacked and built into pallets. Each of those steps repeats for every case that crosses the station, and the strain on backs and shoulders is worst late in a long shift.
Seasonality changes the timing of that work. According to NCA's 2026 State of Treating report, as published by Snack and Bakery, the four big seasons of Valentine's Day, Easter, Halloween, and the winter holidays made up 63% of 2025 confectionery sales. Nonchocolate rose to 40.9% of sales in the same report, so more volume is moving through packing stations in general.
A cobot is most useful in the peaks and in the hours that are hardest to staff. A peak also raises the cost of any stopped unit, so plan service and backup coverage before the season starts, not during it.
How does the cobot ROI math actually work?
The core calculation has four inputs. First, the hours per shift and per week of case packing and palletizing that the robot takes over, measured on your own lines. Second, the share of that work the robot realistically handles, since some cases, pallet patterns, and changeovers stay with people. Third, the local wage for laborers and freight, stock, and material movers, hand from the government wage data on this page. Fourth, the lease payment, which is quoted after a free site assessment.
The labor side is the hours taken over, multiplied by the share the robot handles, multiplied by the wage. Subtract the lease payment, plus the time people still spend supervising, loading, and clearing faults. What is left is the saving. Because the inputs are ranges, the result is a range, and a single number would be a promise we do not make.
Overtime is a separate lever. If the night shift relies on paid overtime to cover packing, the robot offsets that overtime first, and that can change the result more than base hours do. Your site assessment shows whether overtime is part of your schedule.
What changes the number up or down?
Pattern variety is the biggest lever on the cobot ROI for candy manufacturers. A line that runs a few carton sizes and standard pallet patterns gives the robot a high share of the work. A line that changes patterns many times a week keeps more of the work with people, and the range moves down.
Night coverage and peak length also move the result. The larger the gap on nights and the longer the seasonal peak, the more the robot's hours matter. Downtime during a peak pulls the range down, which is why service planning belongs in the math.
What are the risks to the return, and how do you avoid them?
The most common risk is counting every hour as robot work. A cobot takes a share of case packing and palletizing, not all of it. Start from measured hours and a conservative share, then test that share on one station before you scale.
Changeovers are the second risk. Each new pattern or carton size needs a reset, and that time stays with people until the pattern is programmed. Plan changeover time into the schedule and ask the integrator to program the most common patterns first.
Training and uptime are the third risk. Staff who cannot clear a fault or reset a pattern leave the robot idle. Training during deployment, a named lead on every shift, and a clear escalation path keep the hours flowing.
Why do injury and turnover numbers matter for this decision?
According to a Voxel AI summary of BLS data, food manufacturing recorded 3.3 total recordable cases per 100 full-time workers in 2024. Manufacturing Dive reported food manufacturing at 3.6 in 2023 and 4.6 in 2022. The same summary puts all manufacturing at 2.7 for 2024, so food plants still run above the broader factory level.
Turnover is harder to pin down for food. According to a 247wallst report, the quits rate for all manufacturing was 1.7% in May 2024, about 217,000 quits. That covers all manufacturing, not food alone, and we did not find a food-manufacturing separation rate in the Job Openings and Labor Turnover Survey, so this page does not quote one.
Taken together, the case for robots on packing lines rests on ergonomics and staffing stability rather than one injury statistic. Ask your safety lead for your own incident history before you set a target for the range.
How common are robots on candy and food packaging lines?
Packaging World surveyed 118 consumer packaged goods brand owners. A packaging engineer at a large food company said about a fifth of its North American plants use robots, mainly for case packing and palletizing. That points to the packing end of the line as the first place food plants automate.
The IFR World Robotics 2025 figure, as reported by Beverage Industry, shows US food and beverage installations of flexible industrial robots rose 21% in 2024. That count covers industrial robots broadly, not cobots, so read it as a sign of rising interest in the sector and not as a cobot adoption rate.
What is the timeline from site assessment to payback?
The sequence runs in phases. The free site assessment maps the packing area and times the case packing and palletizing hours on your shifts. Next come the quote, the lease financing, and the choice of robot that fits your floor and pattern mix.
After signing, the robot is deployed and integrated, staff are trained, and go live support follows. Most lines start with a pilot on one station, because the pilot tests the share of work the robot really takes. Payback is measured against the hours you actually see, so the timing is set by results, not by a promise.
Service Robot Co. is a US commercial robot integrator. We pick the right robot for the site, lease it through financing, deploy and integrate it, train the staff, and service it nationwide, with one partner and one number for the whole job.
How do you get a precise figure from a free site assessment?
Ask for the assessment before you rely on any range. We time the case packing and palletizing hours on your actual shifts, count the carton sizes and pallet patterns, note changeover frequency, and map the path from line to station. Those are the inputs the calculator needs.
The calculator on this page is pre-filled for this industry, so the range you see is a starting point. The assessment replaces the assumed hours and share with your measured ones, and then the lease payment is quoted in writing. Service is handled by us nationwide.
Bring your shift schedule, your pattern list, and any overtime records. The more measured hours the assessment has to work with, the tighter the range becomes.
Frequently asked questions
Want a cobot at your candy manufacturer?
Tell us about your site. We will recommend the robot, quote the lease, and keep it serviced.
Sources
- US Bureau of Labor Statistics, Occupational Employment and Wage Statistics (OEWS May 2024)
- BLS Occupational Employment and Wage Statistics, May 2023
- BLS Economics Daily, March 2026
- Voxel AI summary of BLS food manufacturing safety data
- Manufacturing Dive, injury and illness rate report
- Packaging World, what CPGs can achieve with robots and cobots
- Beverage Industry, robotic palletizers coverage of IFR data
- Snack and Bakery, NCA 2026 State of Treating
- 247wallst, manufacturing workers leaving jobs