
The short answer
Cobot ROI for dairy processing plants comes mainly from repetitive packing and case handling hours that a collaborative robot takes over at fixed stations, so existing staff can cover the rest of the line. The savings range depends on the share of those hours the robot realistically performs, the labor value set by the government wage data on this page, and the fixed lease payment quoted after a free site assessment. Payback depends on how fully the robot is used across shifts, so the figure stays a range until the line has been measured.
Key takeaways
- Savings come from repetitive packing and case handling hours, not from removing whole roles.
- The labor value uses the government wage data for laborers and freight, stock, and material movers, hand.
- The share of those hours the robot realistically takes sets the range more than any other input.
- The lease payment is fixed and quoted only after a free site assessment.
- Measure your own line hours before trusting any range, including the one on this page.
Run the numbers for your site
Pick your city or state for a real regional number - we use the real BLS wage there. (On the live site this auto-detects from your location.)
What do you want to automate?
The cobot stacks the repetitive end-of-line pallets; your team handles changeover and QA.
What does cobot ROI look like for a dairy processing plant?
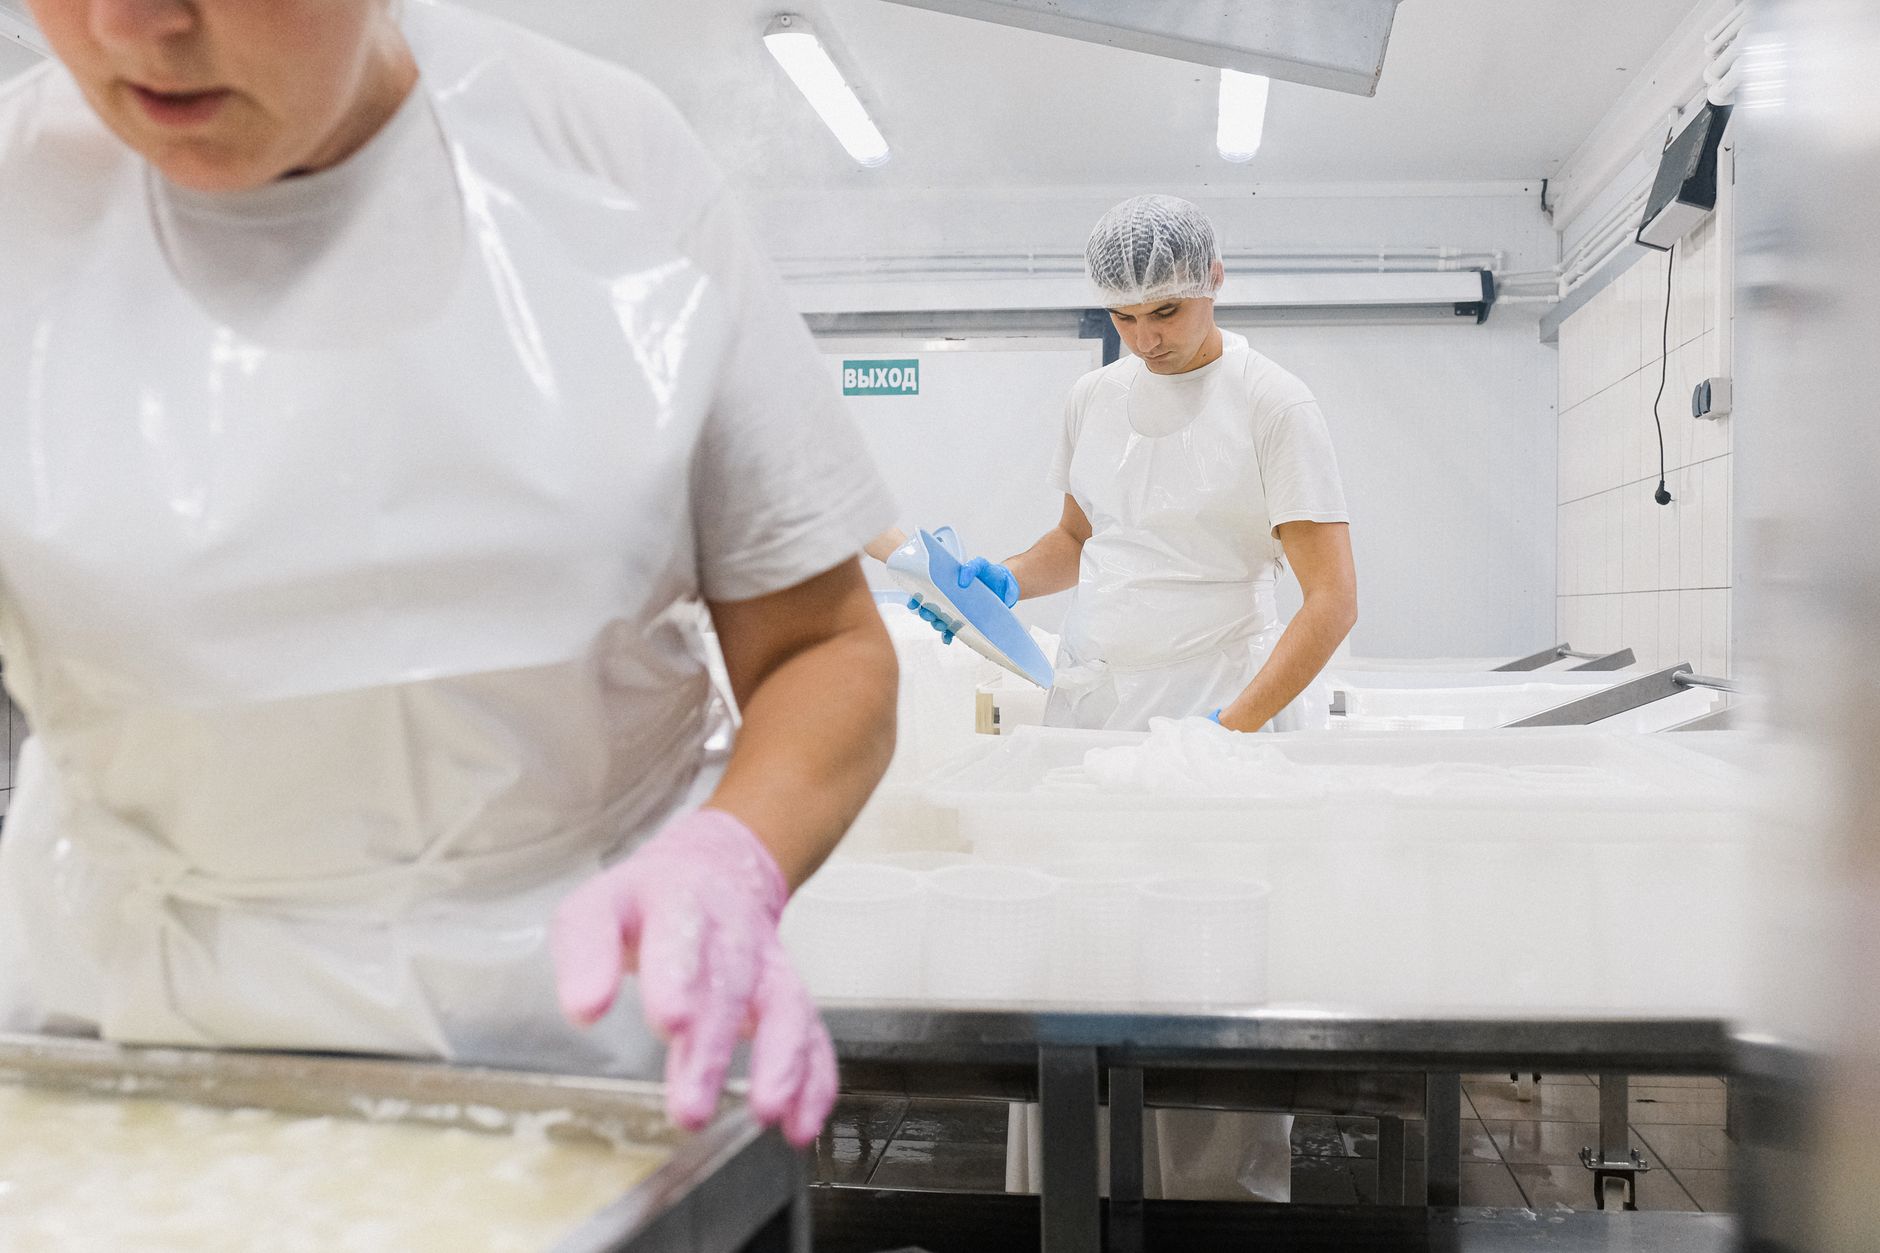
A dairy processing plant pasteurizes, separates and processes raw milk, then packs the product into cartons, bottles, cups, pouches and cases. The Ag Marketing Resource Center reports that the US had 1,266 dairy product manufacturing plants in 2019, down 60 from 2017, and that Wisconsin had more plants than any other state. That count is built on older USDA data, so read it as the trend rather than a current total.
Newer counts point the same way on the number of sites but show heavy investment. The International Dairy Foods Association reports more than 85 processing investment projects across 23 states. DairyMAX's Texas fact sheet lists 32 dairy processing plants in Texas, based on 2023 USDA data, which shows how a single state can hold dozens of sites.
For cobot ROI, the useful unit is the packing line at one site, not the national plant count. That is where the staffing, the hours and the injury exposure sit, and it is where the math has to be done.
Where does the return come from on a dairy packing line?
The return comes from hours staff spend on repetitive, fixed-station work: picking filled containers off the line, placing them into cases, stacking cases and moving them toward pallet stations. A collaborative robot arm handles this kind of work well when it works beside people rather than inside a fenced cell. The work repeats, the stations stay put and the product is predictable, which keeps the robot's share of a shift high.
Staffing is the other side of the math. IBISWorld estimates the average US dairy product manufacturing business employs 183.7 people, and VerticalIQ estimates about 143 employees for a single-location business. Those are whole-business averages from commercial estimates with methods not shown. Rounded, the IBISWorld average is 184 people, the planning figure used for total site staff here, but the packing share of that headcount has to be counted on your own site.
Turnover is why many plants find this work hard to keep filled. FRED's series for nondurable goods manufacturing, which includes food, shows a total separations rate of 2.6 for February 2026, seasonally adjusted. That is a broad manufacturing figure rather than a dairy one, and no BLS series for dairy or packaging occupations turned up in our research. It still shows that churn runs through the sector, and each open shift a plant cannot fill is labor the robot can cover in part.
Median hourly wage, Laborers and Freight, Stock, and Material Movers, Hand
$4,380
Monthly cost of one full-time worker, at the median wage plus payroll costs (an estimate, not a quote).
How does the cobot ROI math work?

The math has four inputs. The first is the hours of repetitive packing and case handling per shift and per week at the station the robot will cover. The second is the share of those hours the robot realistically takes, which is almost never all of them, because staff still load, clear jams, change over and handle exceptions. The third is the labor value of those hours, based on the government wage data on this page for laborers and freight, stock, and material movers, hand. The fourth is the fixed lease payment, the financing term and the service terms, all set in a quote after a site assessment.
Savings equal the labor hours the robot takes over, valued at that wage, minus the lease payment and any recurring support cost you carry. Payback is the point where cumulative savings cover any setup and integration costs along with the lease payments. The savings range on this page comes from these same inputs, so a change in measured hours or in the share the robot takes moves the range more than any other single input.
The robot does not replace the person whose wage sets the value. It takes the laborers and freight, stock, and material movers, hand type of work off the line, and the staff who remain move to tasks the robot cannot do, such as changeovers, quality checks, sanitation support and exception handling. That is why the valuation uses the wage for that kind of work and not the wage of the people who stay on the line.
What changes the number up or down?
Line uptime and shift pattern matter most. A line that runs longer shifts, or more shifts in a week, gives the robot more hours to cover, and the same unit spreads its setup across more output. A line that stops often for jams and changeovers gives the robot fewer usable hours, and the range should reflect that.
Product format matters too. Stable case sizes, consistent carton orientation and fixed stations let the robot hold a high share of its shift. Frequent SKU changes, mixed case patterns and irregular product presentation lower that share, and each format swap adds setup time that does not pay back on its own.
Cold and wet conditions move the number as well. Dairy packing areas are often cool, damp and washed down on a schedule, so equipment has to suit that environment, and sanitation windows take time away from production. The robot's schedule has to fit around those windows rather than fight them.
Staffing context changes what the savings look like. Where a station cannot be filled at all, the robot covers a shift the plant would otherwise run short. Where staff are plentiful, the savings show up as freed hours and fewer overtime hours rather than as a smaller headcount, and the number looks smaller on paper even when the line runs better.
What are the risks to the return, and how do you avoid them?
The biggest risk is over-scoping. A robot pointed at a station where only a small part of the work is truly fixed will look weak against the plan. Start with the one station where the work repeats and the hours are clear, then expand once the first months of measured data are in.
Safety is the second risk, and it is also part of the reason for the work. The California Department of Industrial Relations reports an incidence rate of 3.8 for NAICS 3115, dairy product manufacturing, in 2024, with 0.6 thousand nonfatal cases, and a cheese subcategory at 4.0. The source does not confirm its denominator basis, so use these figures as direction rather than a benchmark. Collaborative robots are designed to work near people, but each site still needs a risk assessment, guarding decisions and staff training before go live.
Downtime is the third risk. A single leased unit has no built-in backup, so the plan should cover what happens when it is down, including spare unit coverage and on-site dispatch when needed. Remote triage shortens the gap, but the plan should also name who covers the station while the unit is out.
What is a realistic timeline from assessment to payback?
Most plants move through four stages: the site assessment and measurement, the lease quote and financing decision, deployment and integration with staff training, and go-live support followed by measured operation. The assessment is where hours, share and layout get measured rather than estimated, and it is the step that narrows the range.
Timing from assessment to a stable run depends on the station, the integration work and the plant's own approvals and sanitation rules. A single station with clear layout, existing power and a working network can move faster than a multi-station line that needs guarding changes. Payback should be judged on measured hours across a fuller run, not on the first weeks, which carry setup and learning time.
Plan a pilot on one station before any second station, and let the pilot's measured hours set the next decision. That keeps lease exposure to one unit until the numbers have been verified on your own line.
How do you get a precise figure from a free site assessment?
A free site assessment replaces the range on this page with your own figure. It maps the packing line, records each station and the work done there, measures the hours of repetitive tasks across a normal shift and week, and checks the floor, power, network and sanitation conditions the robot would work in.
Bring the records you already have: shift patterns, changeover logs, overtime and open-position history, and injury logs for the line. Those let the assessment separate the hours that repeat from the hours that do not, which is the step that most affects the share the robot can take.
The output is a quote for a fixed lease payment, the financing term, the service terms and a savings estimate built from your measured hours. We pick the robot for the site, deploy and integrate it, train staff and service it nationwide, so the figure you approve covers the whole run, not just the hardware.
Are cobots widely adopted in manufacturing yet?
Adoption is growing. The International Federation of Robotics reports that new cobot installations reached 66,000 units, about 11 percent of industrial robot installations, in the most recent IFR figure in our research. Earlier IFR releases put cobots at about 12 percent of installations in 2024, more than 64,500 units, and about 10.5 percent in 2023.
Globally, IFR reports that industrial robot installations passed 600,000 units for the first time, at 603,000, up 11 percent. That shows the trend is broad, but it says nothing specific about dairy, so the case for your line has to come from your own hours.
A dairy plant has a practical reason to look at cobots. The repetitive station that is hard to staff is often the one where a fixed, predictable robot arm fits best.
Frequently asked questions
Want a cobot at your dairy processing plant?
Tell us about your site. We will recommend the robot, quote the lease, and keep it serviced.
Sources
- US Bureau of Labor Statistics, Occupational Employment and Wage Statistics (OEWS May 2024)
- Ag Marketing Resource Center
- International Dairy Foods Association
- DairyMAX Texas State Fact Sheet
- IBISWorld
- VerticalIQ
- California Department of Industrial Relations
- FRED, Federal Reserve Bank of St. Louis
- International Federation of Robotics