

The short answer
Delivery robot ROI for shopping malls comes from the hours of tenant parcel and carrying work that a leased robot takes off staff on fixed service routes between the loading dock and the stores. The return is a savings range, not a promise, and it depends on how many runs the robot can realistically cover, how often elevators and doors slow it, and the fixed lease payment set after a free site assessment. A site assessment shows which routes carry enough runs to make the number clear.
Key takeaways
- The return comes from repeated parcel runs on fixed routes, not from replacing a whole staff position.
- Savings are shown as a range priced on the hours of waiters and waitresses type of work the robot takes over.
- Older elevators, freight doors and access controls are the most common drag on the number.
- A lease quote follows a free site assessment, so the first figure you see reflects your own routes.
- Judge the return on logged run counts and staff hours, not on a vendor's headline figure.
Run the numbers for your site
Pick your city or state for a real regional number - we use the real BLS wage there. (On the live site this auto-detects from your location.)
What do you want to automate?
The robot walks the repetitive trays; staff stay with guests and tables.
What is delivery robot ROI for shopping malls?
Delivery robot ROI for shopping malls is the value a mall and its tenants keep when a leased robot covers work that staff would otherwise do by hand. In a mall, that work is mostly inbound parcels and supplies moved from a receiving dock through service corridors to the stores, plus some outbound returns and trash runs. Most of the value sits in repeated trips on the same route, which is exactly the kind of work a fixed path handles well.
The number is a range, not a single figure. The calculator on this page is pre-filled for this setting and shows a savings range built from the hours the robot can take over, the share of those hours it can realistically cover, and the lease cost. The range moves with the layout of your building, the volume of tenant deliveries and how much access the robot gets during open hours.
We are a US commercial robot integrator. We pick the robot that fits the site, arrange commercial robot leasing through financing, deploy and integrate it, train the staff who work with it and service it nationwide. We do not give a lease figure before the site has been assessed, because the routes and access points decide most of the answer.
How many shopping malls and centers are there in the US?
Counting the places where this work happens is the first step in sizing a program. Fox Business reports a count of 1,170 malls in 2019 and says the count has risen every year since 1970. That is a 2019 figure, so use it for scale and confirm the latest number for any market you target.
Shopping centers are a wider group than malls. A Chain Store Age headline puts US shopping centers at nearly 108,000, while a summary of the same industry data cites 115,049 centers. The two numbers do not match, and the date of the larger figure is not confirmed, so trace the number to its original table before it goes into a proposal.
Median hourly wage, Waiters and Waitresses
$3,798
Monthly cost of one full-time worker, at the median wage plus payroll costs (an estimate, not a quote).
Where does the return come from in a mall?
Most of the return comes from carrying work that is steady, repetitive and predictable. Tenant parcels arrive at a receiving dock during set hours, then go store by store along the same service corridors. Each trip is short, but the trips add up across a day, and the staff who make them are pulled away from the work they were hired to do.
The savings figures on this page are built on the hours of the waiters and waitresses type of work the robot takes over. In practice that means carrying and delivering items along a fixed path. Maintenance, receiving and security staff keep their own jobs, their time is not priced in the return, and the robot takes the carrying off their plate rather than replacing them.
The government wage data on this page gives the local wage for this job, which the calculator uses for the labor side. Our estimate, not a published count, is that a typical mall has about 4 people doing this kind of carrying work at one site. The Bureau of Labor Statistics projects 2% growth for janitors and building cleaners from 2024 to 2034, which is slower than the average for all occupations, so staffing this work will not get easier, though the mall's own records should set the actual hours.
How does the ROI math work for a mall delivery robot?
The math has three parts. First is the hours of waiters and waitresses type of work the robot takes over each week, meaning the runs it completes on fixed routes. Second is the share of those hours the robot can realistically cover, which is always less than the total because some runs need a person, some doors are closed and some routes are blocked at peak times. Third is the lease cost, paid through a fixed lease payment set in a quote after the site assessment.
The offset is the labor hours that move off staff, valued at the local wage for this job, minus the lease and the support cost. The calculator shows that offset as a savings range. A range is the honest output, because each input is an estimate until a site has been measured. Plan around the lower end and treat the upper end as what a well-routed site can reach.
Payback is the point where cumulative offsets cover the cost of deployment and the lease. A short payback needs a high run count on a clean route. A long payback usually means a short route, a busy shared elevator or a building that needs access work before the robot can move freely.
How many hours of work does the robot actually take over?
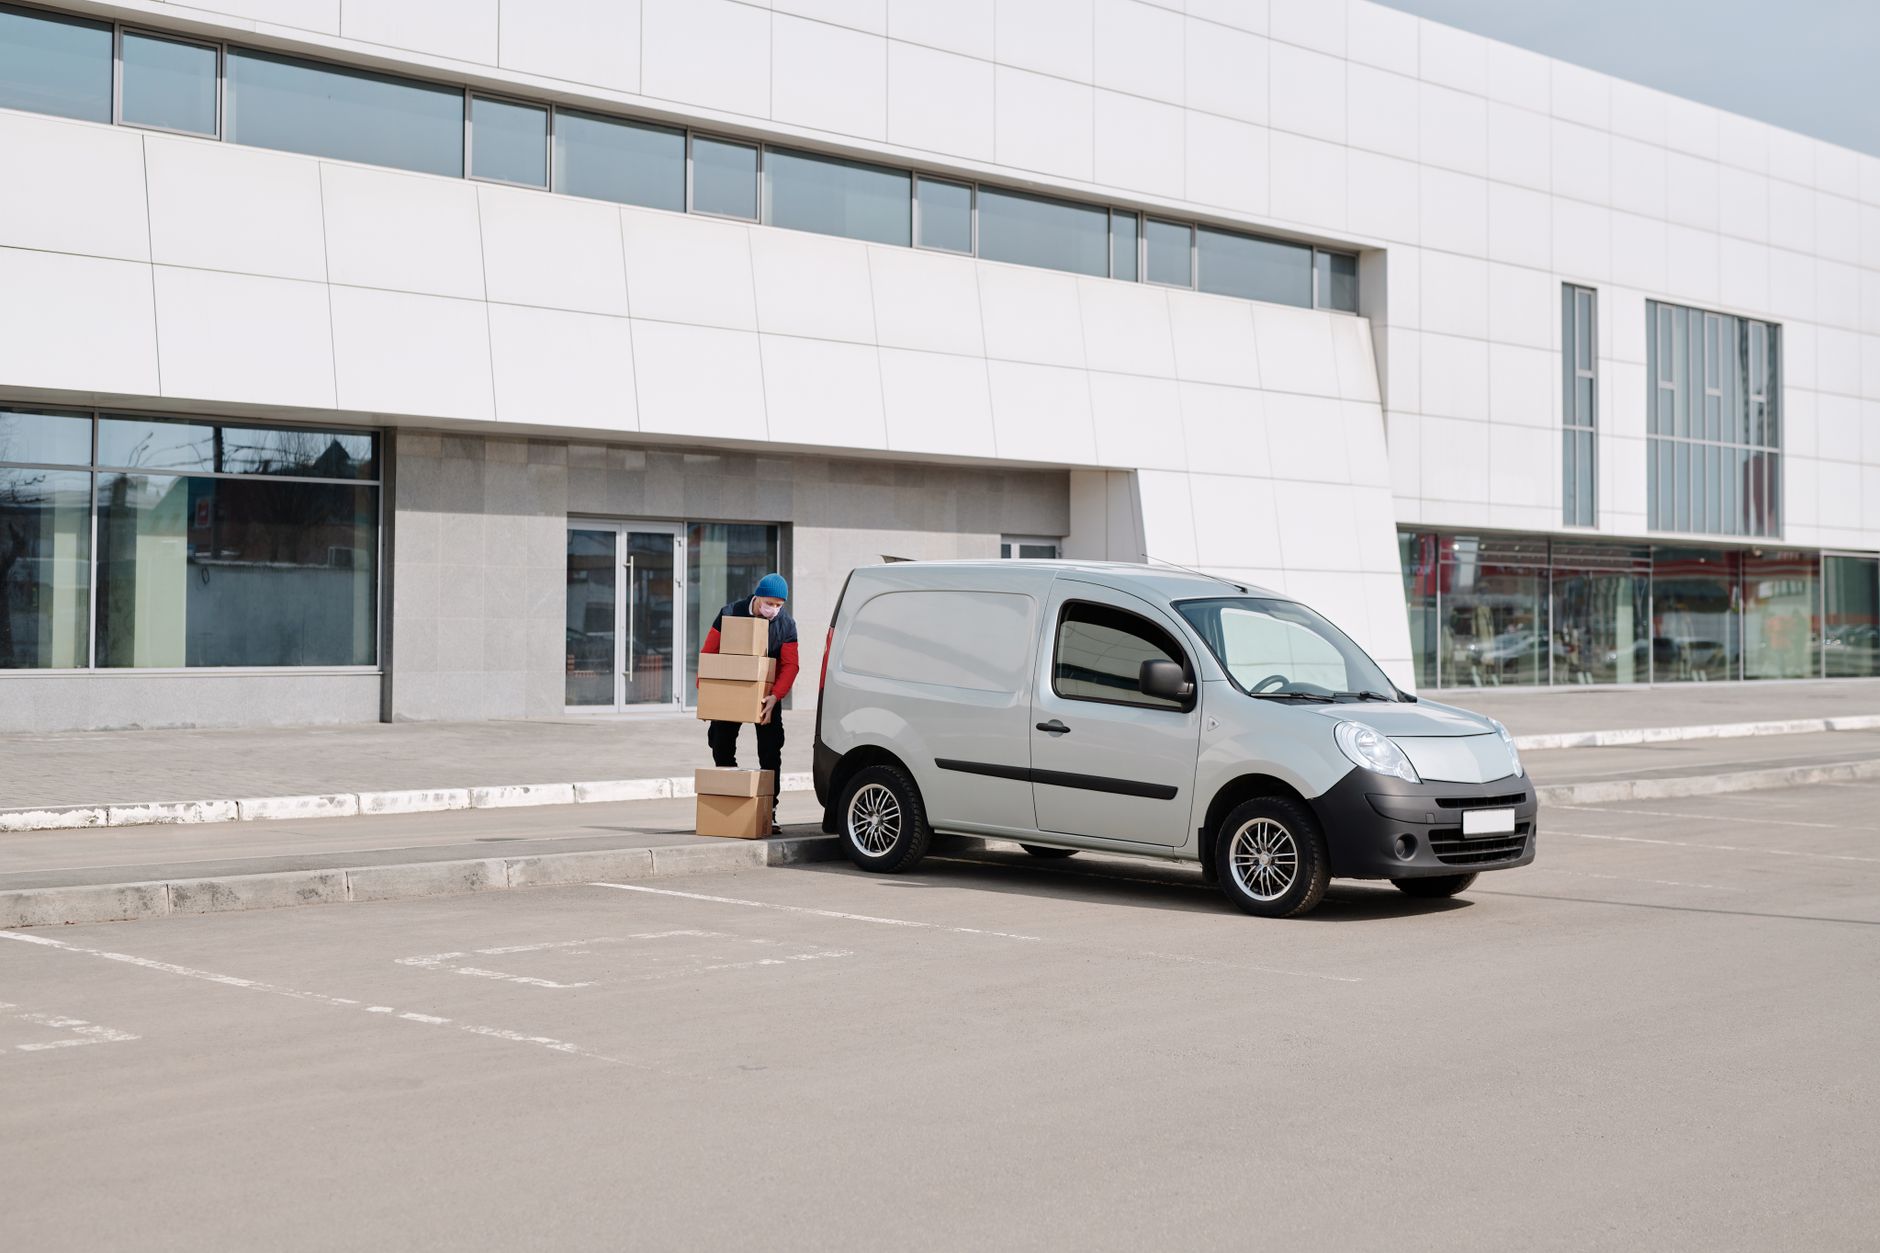
Hours are the easiest figure to overstate, so count them on your own routes. Start with the runs that move tenant parcels and supplies from the dock to the stores, timed from the logs your receiving team already keeps. Add return runs and small loads to the same stores. Then remove the steps a robot cannot do, such as signing for restricted items or moving oversized loads.
The realistic share is what the table below shows. A robot on a clean route at off-peak hours can cover most of that route's trips. On a route that crosses a shared elevator or a freight door staff must open by hand, the same robot covers fewer trips and waits more. The gap between those two cases is where most of the difference in return comes from.
How does a delivery robot compare with staff on mall runs?
The robot is better at steady, repeated trips on a known path. It does not tire late in the day, it follows the same route at the same speed each time, and it keeps a log of each trip, which makes the hours easy to audit.
People still win in several places. A person can read a dock schedule that changed overnight, sign for a restricted delivery, lift an awkward load, reroute around a closed corridor and explain a delay to a tenant. The honest comparison is that the robot takes over a narrow, repeatable slice of the day, and the staff keep the rest.
- Repeated runs on a fixed route
Delivery Robot
Consistent trips on the same path, logged automatically
Staff
Strong for short bursts, but slows and loses time on long repeat routes
- Changes to the schedule or route
Delivery Robot
Follows its set route and waits or reroutes within set limits
Staff
Handles a changed dock schedule, a blocked corridor or an unusual load
- Signing and restricted items
Delivery Robot
Not suited to signature or restricted-item steps
Staff
Can check ID, sign and handle high value or awkward items
- Peak shopper traffic
Delivery Robot
Slows and waits in crowded corridors, which cuts usable hours
Staff
Steps around people and adjusts pace
- Cost basis
Delivery Robot
Lease set after assessment, with setup and checks in the quote
Staff
Priced on the local wage for this job, with hours from your timesheets
What do injury and safety figures mean for the return?
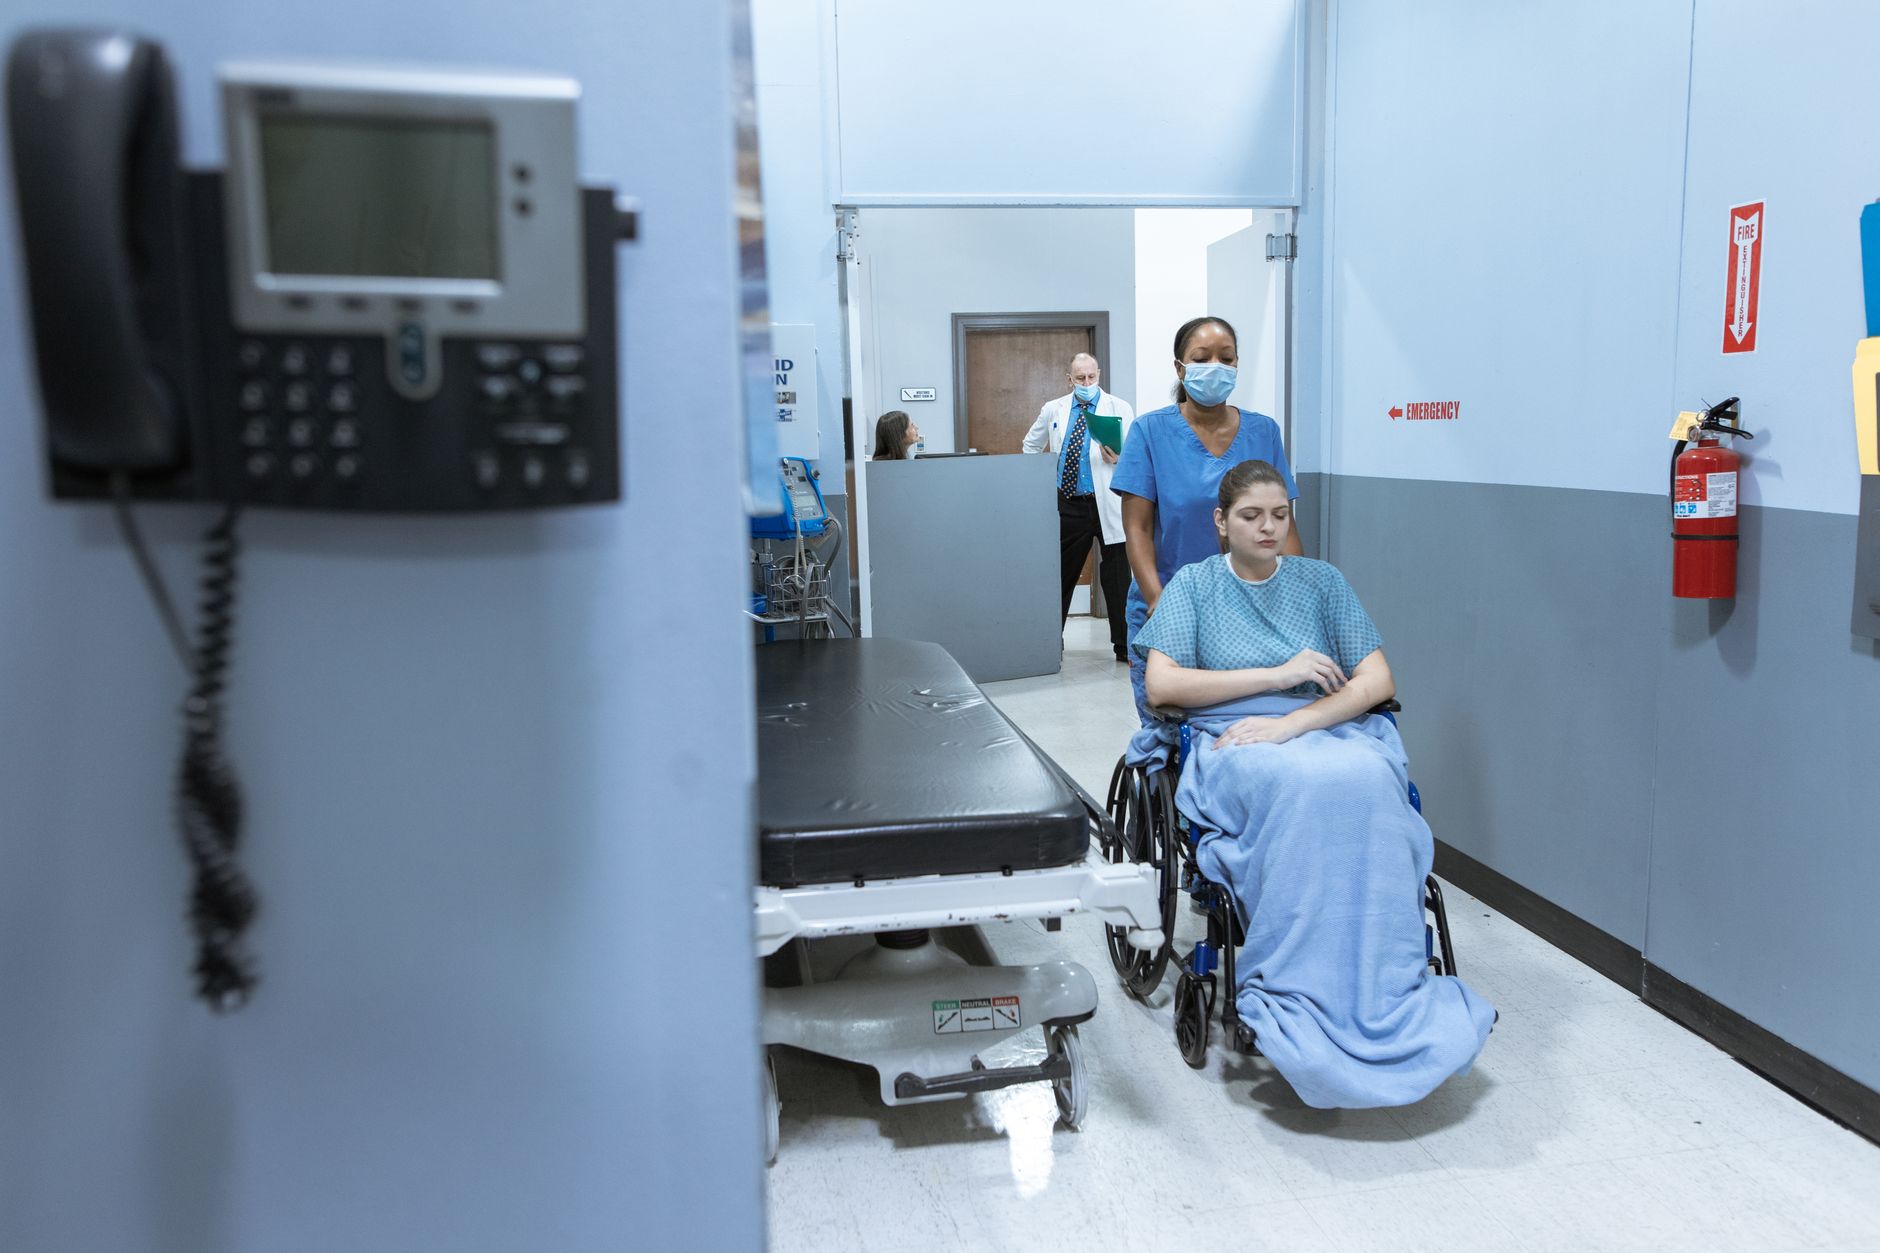
Injury figures are background for any repetitive carrying job. According to a third-party mirror of Bureau of Labor Statistics 2024 injury data, private industry recorded about 1.46 million days-away-from-work cases, at a rate of 1.4 per 100 full-time-equivalent workers. That covers the whole private economy, so it sets the scale rather than a mall rate, and the retail-specific days-away rate was not retrieved for this page.
A 2026 trade article reports, according to Carrier Management, that retail was one of five sectors whose total recordable case rate fell in 2024, and that no sector rose. That is good news for injury trends, but it does not change the logic of the return. Robots that take repetitive carrying off staff can reduce handling on those routes, and the change should show in your own incident log, which is the record to check after go-live.
What are the risks to the return, and how do you avoid them?
The biggest risk is the building itself. Vendor research on this market names older buildings as a barrier, because elevators, doors and access controls were not designed for automation. A shared elevator the robot cannot call, or a freight door that needs a person to open it, will cost hours before the robot moves a single parcel. The assessment finds these gaps, and the fix is often an access change rather than a robot change.
The second risk is the route itself. A route that changes often, or a corridor used for events and pop ups, forces remapping and cuts usable hours. Keep the route fixed for the first months and set a clear rule for temporary closures. The third risk is downtime. A single robot that stops during a busy receiving window puts the route back on staff, so a backup robot program and spare unit coverage belong in the plan from day one.
We manage these risks with site assessment mapping before any quote, a pilot on one route, staff training before go-live, and remote triage with on-site dispatch when a fault occurs. Start with one leased unit on the route with the highest run count, then decide whether to add routes. That keeps the first commitment small and tests the numbers on your own floor.
What do adoption figures say about delivery robots in commercial buildings?
Adoption data for this exact setting is thin. A market research page reports more than 5,000 indoor delivery robots deployed in commercial settings in 2023, with healthcare over 1,200 units and commercial buildings over 60% of deployments. That source is vendor-reported and gives no methodology, so read it as a direction, not a benchmark.
A trade article reports that semi-autonomous systems hold 37% of a market segment, mainly in hospitality and smaller commercial buildings. The excerpt does not clearly define the base, so the 37% should not be read as a share of malls. We did not find a published pilot aimed at US mall loading docks or tenant service corridors, which is why the site assessment matters more here than any headline figure.
How long until payback, and how do I get a precise figure?
The timeline runs in order: a free site assessment, mapping of the routes and access points, a quote for the fixed lease payment, deployment on one route, staff training, go-live support, then a review of logged hours against the range. The exact timing depends on access work in the building and on how quickly any elevator or door change can be made, so the assessment is where dates get set. We do not give a payback date before those inputs are known.
To get a precise figure, bring three things to the free site assessment: tenant run counts per day by route, the hours your receiving and maintenance teams log for those runs, and a list of elevators, freight doors and access controls on each route. With those, the savings range narrows, and we quote the lease after the assessment. Use the range to plan until a pilot logs real runs, then update the figure with your own data.
Frequently asked questions
Want a delivery robot at your shopping mall?
Tell us about your site. We will recommend the robot, quote the lease, and keep it serviced.
Sources
- US Bureau of Labor Statistics, Occupational Employment and Wage Statistics (OEWS May 2024)
- Fox Business: US malls
- Chain Store Age: US shopping center industry
- Bureau of Labor Statistics Occupational Outlook Handbook: janitors and building cleaners
- Third-party mirror of BLS 2024 injury and illness data
- Carrier Management news, February 2026
- Market research page on indoor unmanned delivery robots
- BSM Magazine: US leads in adoption of robotics technology