
The short answer
Autonomous mobile robot ROI for apparel distribution centers comes mainly from peak-season picking hours that stop being spent walking. A robot carries totes to the picker along a fixed route, so the existing shift covers more order lines without added shifts. The savings range depends on how much of the picker's day is travel, the share of that travel the robot can realistically take over on your floor, and the lease cost quoted after a free site assessment.
Key takeaways
- Most of the return comes from picker travel that stops, not from removing pickers.
- Published apparel case reports show large pick rate gains, but they are company-reported and come from different systems.
- Warehousing and storage recorded 4.8 total recordable cases per 100 full-time workers in 2024, so fewer long walks matter for safety too.
- The savings range moves with travel share, order profile, peak length and lease terms.
- A free site assessment turns the range into a quote based on your floor plan and your pick data.
Run the numbers for your site
Pick your city or state for a real regional number - we use the real BLS wage there. (On the live site this auto-detects from your location.)
What do you want to automate?
The robot takes the repetitive cart and pallet moves off the heaviest motion.
Autonomous mobile robot ROI for apparel distribution centers: what to expect
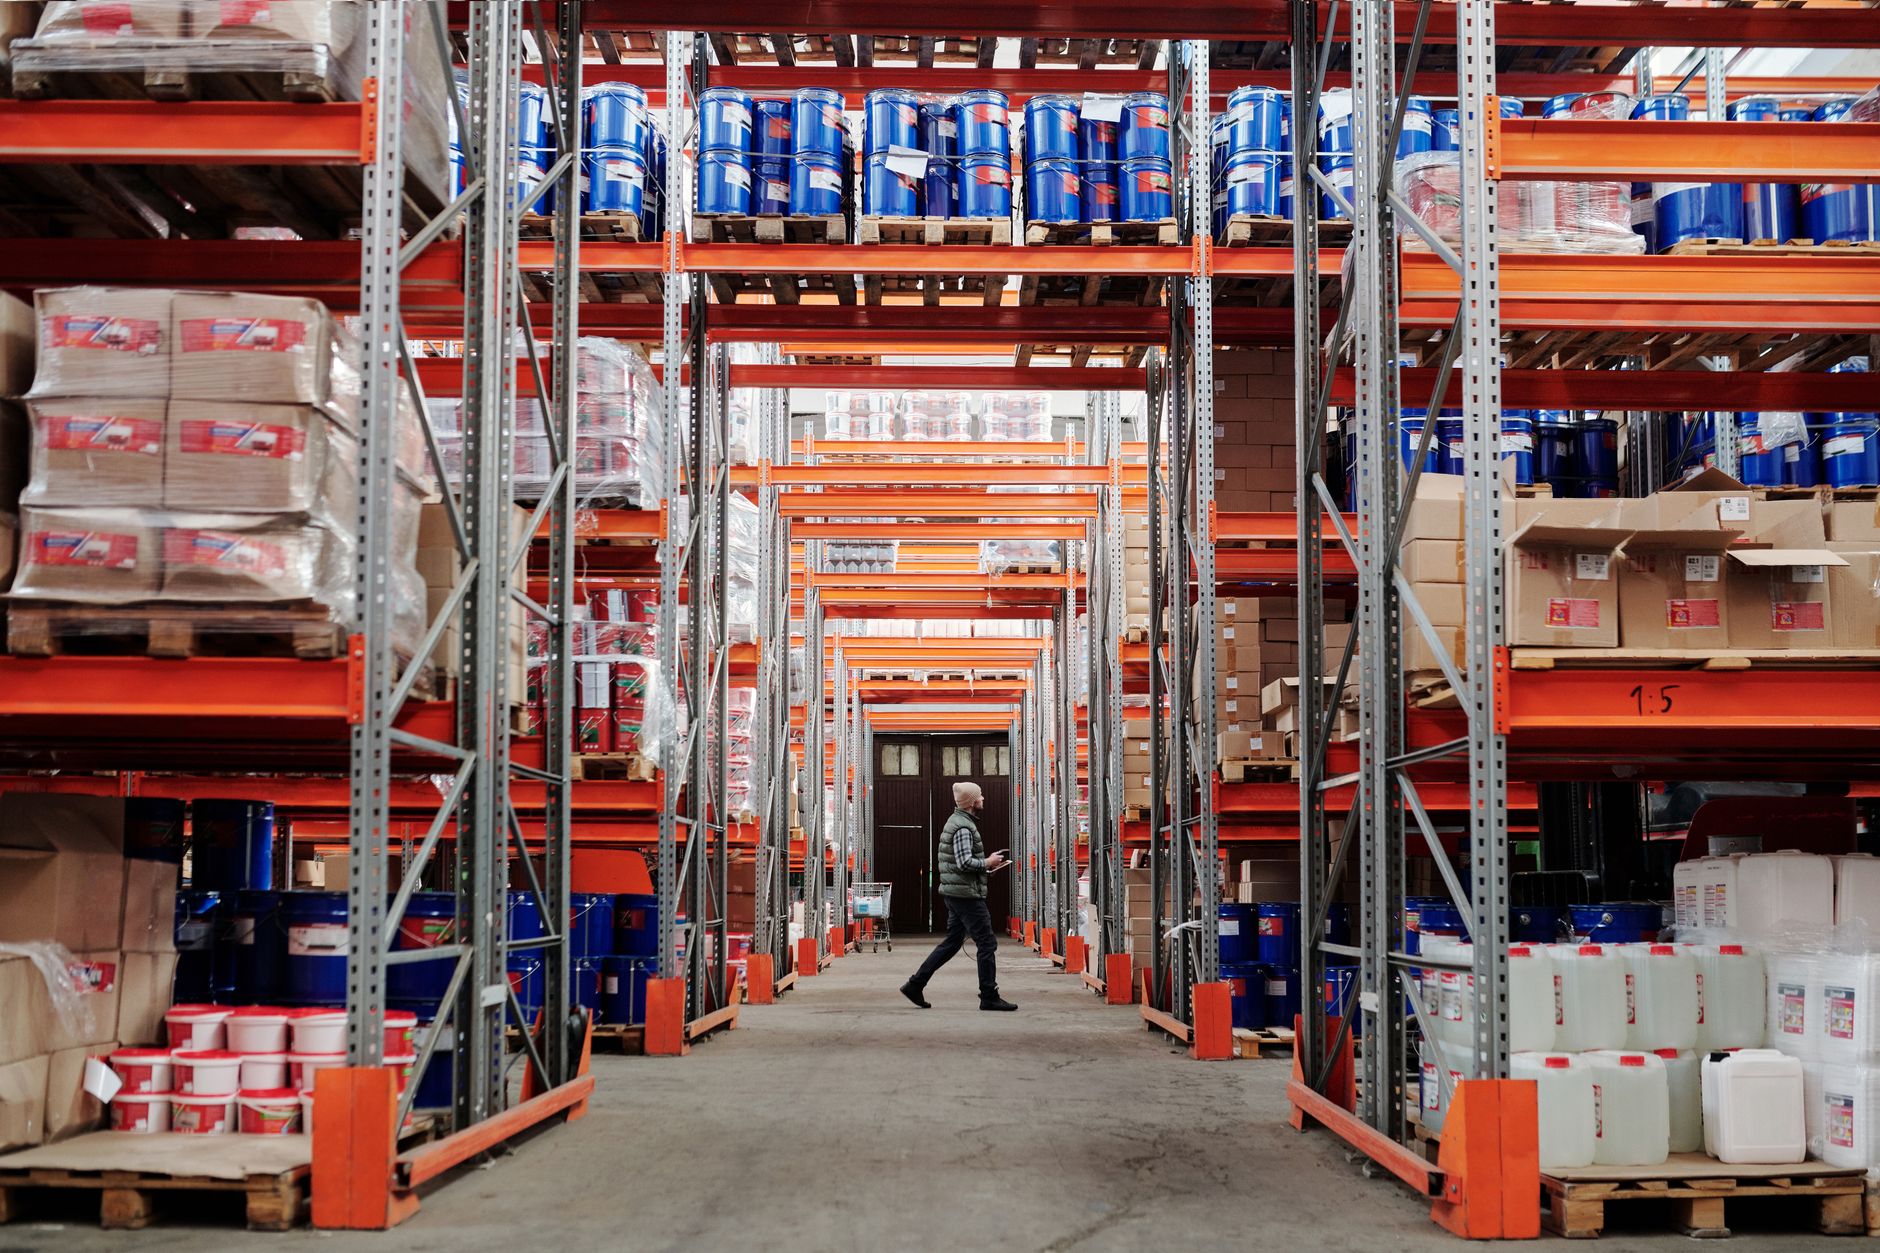
The return on autonomous mobile robots in an apparel distribution center shows up first as peak-season picking capacity. Apparel is high-SKU work: a single order can touch many shelf locations, and pickers spend a large part of each shift walking between them. A robot that carries totes to the picker along a predictable route removes some of that walking, so the people already on the shift can complete more order lines.
The return is not a single number. It is a range built from hours of travel that stop, the share of that travel a robot can realistically cover on your floor, and the lease cost quoted after a site assessment. The sections below show how each part is built, what moves it, and how to replace the range with your own figures.
Why does apparel picking take so many labor hours?
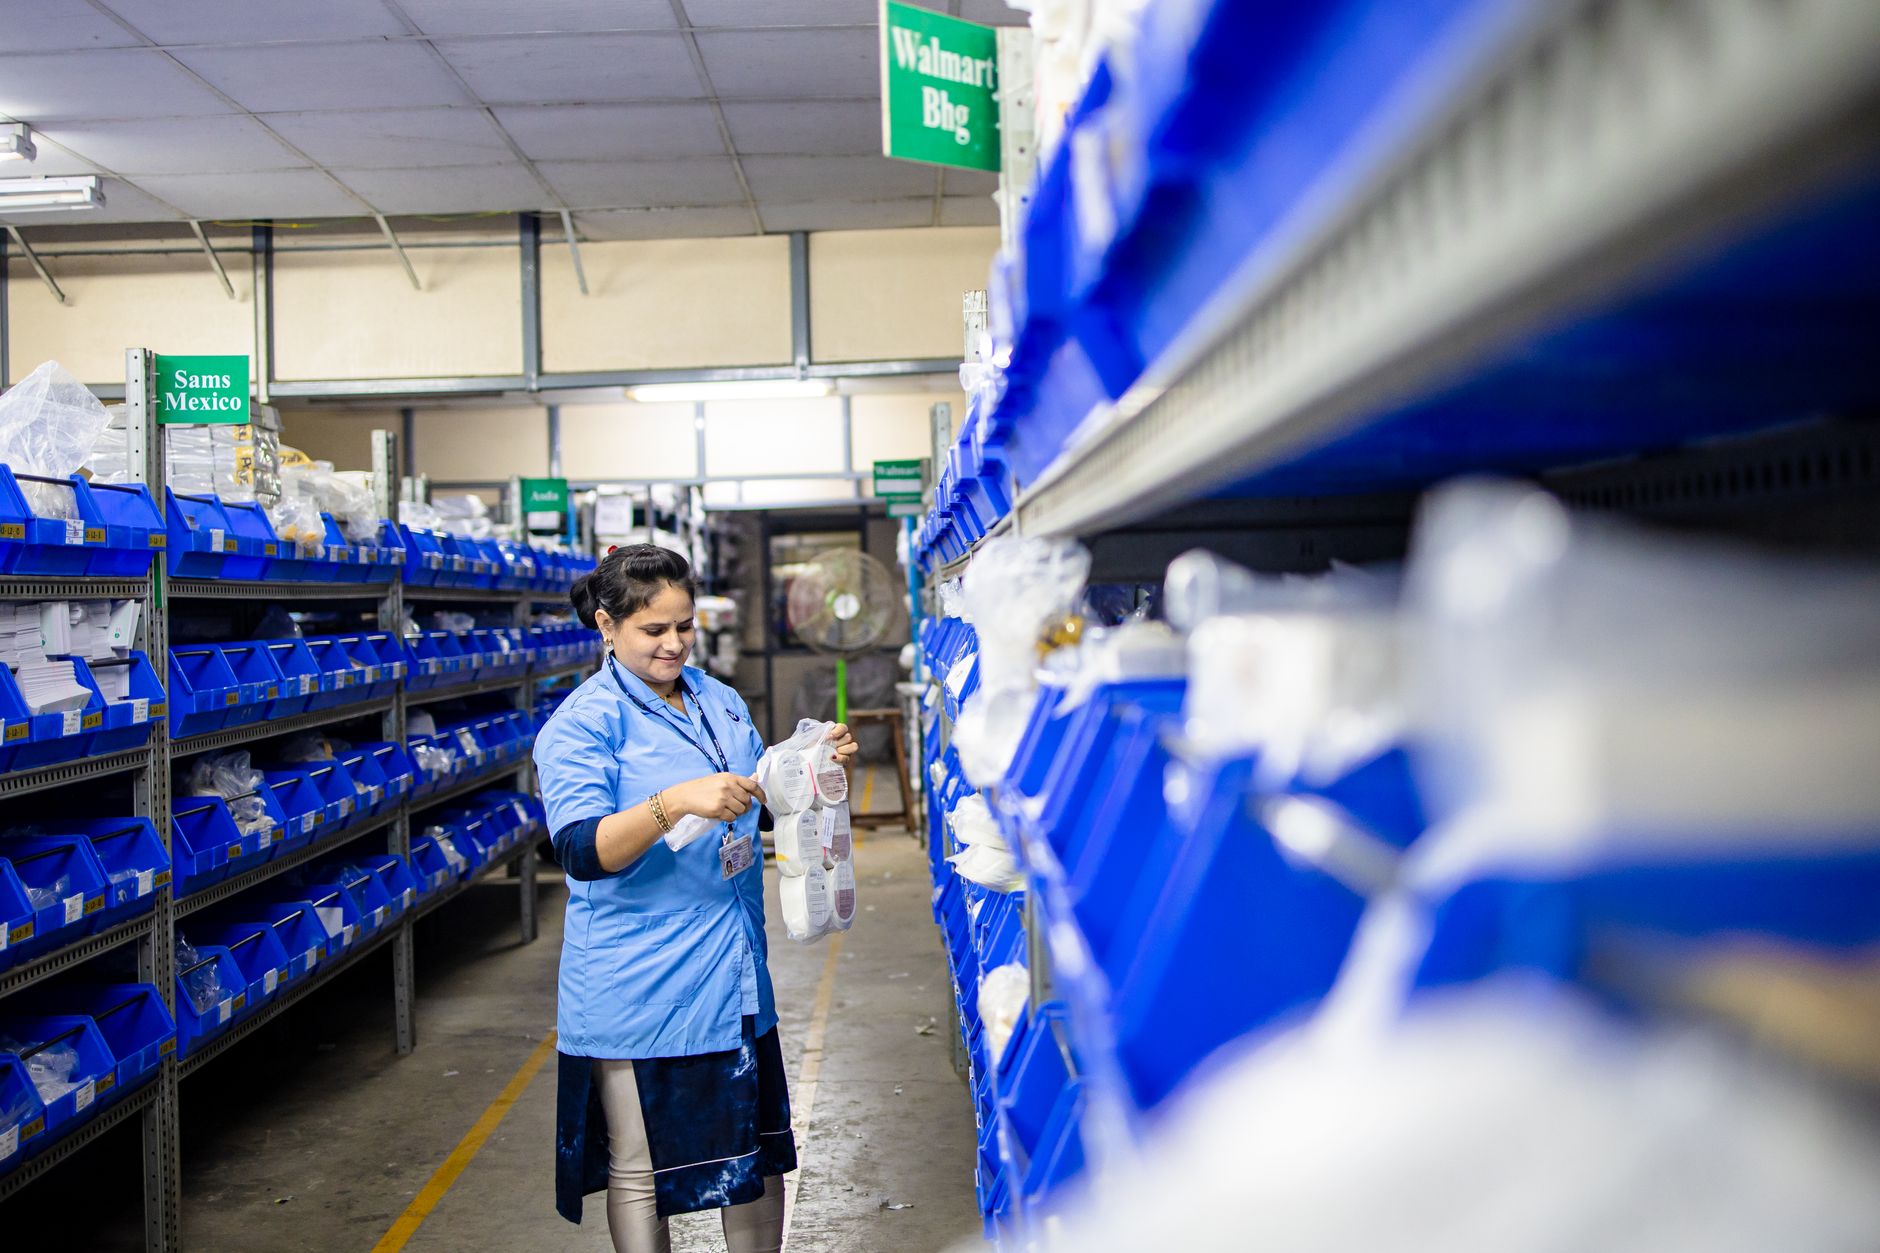
High-SKU picking means long, repeated walks. Each trip between shelves covers distance that adds nothing to the order itself, and a wide catalog with many small lines multiplies those trips. Vendor material claims that walking and manual order picking account for more than 50 percent of picking time. That is a marketing estimate, not a measured study, and we found no independent travel-time study for apparel distribution centers.
The work a robot takes over is laborer and material mover work. The Bureau of Labor Statistics Occupational Outlook Handbook counts 2,988,900 jobs in the Laborers and Freight, Stock, and Material Movers, Hand group in 2024. The savings model prices the hours a robot takes over at the wage for that job, and the government wage data panel beside this text shows the local figure.
Facility counts give some context. The Bureau of Labor Statistics table for warehousing and storage shows about 21,600 establishments in the fourth quarter of 2022 and about 22,100 in the third quarter of 2023. A data aggregator, citing Census County Business Patterns, reports 21,521 warehousing and storage establishments with paid employees for 2023, but we did not verify that count against census.gov. We found no count for apparel distribution centers alone.
Median hourly wage, Laborers and Freight, Stock, and Material Movers, Hand
$4,380
Monthly cost of one full-time worker, at the median wage plus payroll costs (an estimate, not a quote).
How is the ROI calculation built?
The calculation starts with the hours of laborer and material mover work the robot takes over. It takes the travel share of picker time, removes the part a robot cannot realistically cover, and converts the remaining hours into labor value at the wage for this job. This labor offset is the largest input to the range.
The next input is the realistic share of the work. A robot does not take all travel. Aisle geometry, pick density, tote handoffs and congestion limit how much of the route the fleet can cover in a given week. The model uses a lower and a higher share, and the range reflects both.
Lease cost is subtracted last. The lease is a fixed lease payment set through financing, and the quote comes after a free site assessment. Service, integration and training are part of the picture too. The result is a savings range, not a promise, and the low end assumes a slower ramp and a smaller share of covered travel.
Where does the return come from in apparel picking?
The clearest published picture comes from trade press on an apparel distributor's Illinois distribution center. According to that report, picks per hour rose from 40 to 150 after a shelf-to-person robotic system went in, and turnover fell 75 percent. The same report says the rollout later reached more than 200 units across two more sites. These are company-reported results from a goods-to-person system, not a travel-based fleet, so use them as direction only.
A vendor case study from the same distributor's Ontario site reports picking productivity moving from 40 to 75 lines per hour, and says training time was cut in half. Vendor figures carry the vendor's interest in the outcome. The useful lesson from both is that the return follows from picks per hour and training hours, and the site assessment can measure both from your own data.
The return shows up on the books as fewer overtime hours in peak, fewer temporary hours brought in, and better use of the staff already on payroll. In most cases it does not appear as a headcount reduction, because peak volume still needs people at the pick face.
What changes the number up or down?
Order profile matters most. Orders with many lines spread across a wide shelf layout give the robot more travel to remove. Dense layouts with short walks give it less to work with.
Peak length matters too. A fleet that runs only a few weeks a year carries its fixed lease cost against a short window. A longer peak or a year-round volume base shortens payback. Turnover matters as well. A staffing firm analysis puts average turnover across warehouse and distribution operations at 11.6 percent, but it does not name the surveys behind that figure, so treat it as a planning input rather than a benchmark. Each new hire also adds training hours during which output is lower.
What risks could weaken the return, and how do you avoid them?
Layout is the first risk. Robots need predictable lanes. Cluttered aisles, blocked staging and mixed foot traffic slow the fleet, and each stop erases part of the travel saving. Mark lanes and clear staging before pilot runs, and test the route at peak density.
Idle units are the second risk. One failed unit during peak can take a route offline. Plan for spare unit coverage or a backup robot program before peak, and write response times for remote triage and on-site dispatch into the service plan.
Overbuilding the fleet is the third. A vendor notes that goods-to-person systems can be hard to cost-justify when volume needs many robots. Size the fleet to the peak week you expect, and start with one leased unit before scaling up.
Safety is part of the case, and not a reason to skip the plan. Warehousing and storage recorded 4.8 total recordable cases per 100 full-time workers in 2024, according to the Bureau of Labor Statistics, with 1.5 days-away cases per 100 full-time workers. Fewer long walks reduce exposure, but robots add vehicle traffic in the aisles, so training and marked lanes still matter.
How long does it take to reach payback?
Payback depends on when the fleet starts earning. The usual sequence runs from site assessment and mapping to the lease quote, financing, deployment and integration, staff training, go-live support, and then measurement against the first peak. Payback is best judged over a full peak cycle, because the first peak tests the route, the staffing plan and the service response together.
For most sites, the first measurable return lands in the first peak season after go-live, provided the assessment confirms enough travel to remove and the fleet is sized to peak. A short peak or a thin order profile stretches that window. The range should show that clearly before you sign anything.
How do you get an exact number from a free site assessment?
A free site assessment replaces the range with your own figures. The assessor maps the floor, measures pick paths, counts pickers by shift, and reviews the order profile and the peak calendar. The output is a fleet size, a route plan, a lease quote through financing, and a service plan with maintenance included.
Bring the pick data from your last two peaks, shift schedules, a layout drawing, and your turnover and training records. Ask the assessor to show how much travel the robot covers and which hours it does not, because the uncovered hours are where the risk sits.
We are a US commercial robot integrator. We pick the robot that fits the site, lease it through financing, deploy and integrate it, train the staff, and service it nationwide. One partner handles the whole path, so there is one number to call when something needs attention.
- Pick data from the last two peaks, by hour and by zone
- Shift schedules and pickers per shift
- A layout drawing with aisle widths and staging areas
- Turnover and training records for the pick floor
- The peak calendar, including the weeks you expect the most volume
Does a robot replace pickers, and what do staff do instead?
No. The robot takes the walking, not the picking. Pickers still choose items, check quantities and handle exceptions, along with the work a robot cannot reach. The hours the robot removes come from travel, and the labor math prices those hours at the wage for the laborers and material movers job.
The wider market points the same way, though it does not measure this fleet type directly. A market research press release reports a projection that over 51 percent of warehouses will have some form of automation by 2030. That figure covers automation in general, not autonomous mobile robots. We did not find a credible 2025 or 2026 survey of AMR adoption in distribution centers.
- Walking the same route
Autonomous Mobile Robot
Repeats the mapped route all shift without fatigue
Staff
Adapts when a lane is blocked or a tote is an odd shape
- Picking
Autonomous Mobile Robot
Does not choose items or check quantities
Staff
Picks, checks counts and fixes exceptions
- Peak flex
Autonomous Mobile Robot
Adds route capacity, limited by fleet size and lane layout
Staff
Can take on any task the shift needs
- Breaks and fatigue
Autonomous Mobile Robot
Runs through the shift on its charging schedule
Staff
Needs breaks and rest, and output tends to fall late in a long shift
- Training
Autonomous Mobile Robot
Needs mapping and route setup before go-live
Staff
Needs training for each new hire, and turnover keeps that training recurring
Frequently asked questions
Want a warehouse robot at your apparel distribution center?
Tell us about your site. We will recommend the robot, quote the lease, and keep it serviced.
Sources
- US Bureau of Labor Statistics, Occupational Employment and Wage Statistics (OEWS May 2024)
- Bureau of Labor Statistics, Warehousing and Storage industry page
- Bureau of Labor Statistics, Occupational Outlook Handbook, Hand Laborers and Material Movers
- Staffing firm analysis of warehouse and distribution turnover
- Trade press report on apparel distribution center picking
- Vendor guide on warehouse travel reduction
- Vendor case study on apparel distribution site picking productivity
- Data aggregator, warehousing and storage establishments
- Market research press release on warehouse automation